Showing posts with label math. Show all posts

Monday, April 14, 2025

(DRAFT) What do university departments provide to the employers of their students (data science)

 I gave a talk at the 2025 INFORMS (Institute for Operations Research and the Management Sciences) Analytics+ conference (i.e., industry practice focused as opposed to research focused) on Where Should the Analysts Live: Organizing Analytics within the Enterprise. The talk was a result of many organizations asking if analytics should be managed within companies centralized or de-centralized.  One of the topics that came up is the fact that much of the practice of data science is learned on the job.  For some people, they may ask if this is the job of universities. I would argue that the practice of data science is so large that this is an impossible ask. I do so from the perspective of someone who for a while was an industry focused professor within an R1 engineering department.

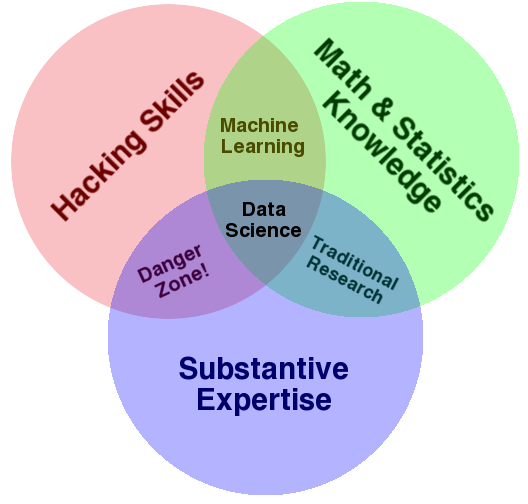
First, what is data science?  Drew Conway still gives the best definition that I have seen in the data science Venn Diagram


Math/stats are the full range of analytical methods as well as the scientific method (the 'science' of data science).  Hacking skills are the computer programming, software engineering, and data engineering specific to working with data (as opposed to what is generally emphasized by academic computer science). Substantive expertise is the subject domain of the work, but it also includes the specifics of the company such as understanding its markets, its customers, and its strategy.

Math/stats is in principle the domain of our university departments.  But university departments are specialists (and research faculty are hyper specialists.  There are two problems with expecting university departments to cover the full range of math/stats that may be needed at a particular company.  First, university departments focus on a particular domain, so it is not expected that they cover other areas of data analysis that a company may need based on their particular interests. Second, they have limited time and unless you are at a very large state university with a particular mission to cover the full range of a subject area, the faculty of a small or medium size department cannot cover the full range of topics that are associated with a given field of knowledge.  So departments create undergrad or graduate programs to cover a foundation, then allow students to specialize (in areas that the department can cover with the faculty they have).  As a non-tenure stream professor, I would explain to students that departments hire to cover a wide range of their field, so they generally do not have much duplication. But each department has to make a conscious choice for what they cover and not cover every time they make a hiring decision.

So what is a university promising with their graduates?  The base set of knowledge and methods (and methods are more important than knowledge, because it is easy to refresh knowledge, you actually need practice with methods), for STEM (and social sciences) the scientific method that creates understanding through iterative experimentation and statistical analysis of experimental results. And most crucially, the capability of learning a technical area. This ability to learn is arguably the most important part of this whole exercise.  Because the world is a big place, and a 17 year old high school student will not be able to predict what the next 40 years will be like. So where a 22 year old college graduate is capable of will be nothing like what she will do over the course of a career. It is hard to develop this ability without college. High school tends to be focused on what you know.  And it is too easy in most jobs to just do what you are doing now, unless you already have the experiences of having to learn new/different domains.  For example, in most STEM and the social sciences, statistics is a side knowledge domain. But for those who go into data science, the fact that they learned statistics makes learning applied machine learning easy.  And the scientific method, while it may not be the thing you think about when you think about engineering or economics, is ingrained into the methods by which they see the world.  It is relatively easy to teach skills, it is much hard to teach mindset or the ability to learn new ways to think.

Is there anything different about artificial intelligence? Actually, yes, which makes it easy to learn for STEM and social science trained people, but also dangerous.  By definition (see  Section 238(g) of the National Defense Authorization Act of 2019) any version artificial intelligence are those which perform tasks without significant human oversight, or that can learn from experience and improve performance when exposed to data sets. In particular, it means that the creators of an artificial intelligence system or model do not have to know how the system that the AI is being added to works. For those in the mathematical sciences (e.g. mathematics, statistics, applied math, operations research, computer science), this is incomprehensible. Even the most theoretical researcher has a core belief that any application of mathematical models involves representing important aspects of the system in mathematical form.  But this makes AI (such as machine learning) relatively easy to use in practice, and this has a low barrier to entry.  But if someone, like a company, actually has subject matter expertise relevent to the problem at hand, not incorporating that expertise into the model is lost value.

Is it enough to be able to learn new skills as needed?  No, we also have to be able to learn to think differently.  The most prominent example is Generative AI. For those who only have knowledge and skills, Generative AI is a completely new thing.  For those who are able to come up with new ways of thinking, Generative AI a combination and extention of deep neural nets, natural language processing, and reinforcement learning trained on the published internet.  And its strengths and weaknesses are not random facts akin to gotchas, but are based on characteristics related to its origins. And knowing that makes a world with Generative AI different, but something that we can use.   This past week I went to a seminar on quantum computing. The mathmatics are completely beyond me. but I could understand enough to recognize the reason for its promise, what is lacking, and some sense of what are some key intermediate steps that have to happen if it ever reaches the promise that many talk about.  And this practice of being faced with completely new subject domains is something I do frequently.

So what can companies expect from the graduates that come from their university partners (whether through former relationships or merely through hiring in the community).  Sometimes it is a collection of specific skills. But more important, a college graduate comes with a testiment that person is able to learn a range of skills and knowledge that are part of a cohesive whole and put them to use. And having done so once, will be able to do it again over a 40 year career.

Thursday, December 31, 2020

Book review: Weapons of Math Destruction: How Big Data Increases Inequality and Threatens Democracy by Cathy O'Neil

Weapons of Math Destruction: How Big Data Increases Inequality and Threatens DemocracyWeapons of Math Destruction: How Big Data Increases Inequality and Threatens Democracy by Cathy O'Neil
My rating: 5 of 5 stars

There is a popular diagram that describes data science as a combination of math and statistics, computer programming skills, and subject domain expertise; and describes the dangers of what happens when one of those three are not available. But among academics, there is an opposed line of thought that says that math and statistics methods are pure and subject independent. This book is firmly against the idea that algorithms are a defense against bias. The reason may be that while the mathematician/machine learning modeler may be naive, the setting of the implementation is not, and the questions that are being asked as well as the data being used to train models are both affirmative choices where the analyst and customer have agency. And pretending to be a naive analyst leads to errors in the result that have real consequences.

O'Neil goes through a number of cases. But while many accounts will go into the "evils" of big data and machine learning, she does suggest good practices that can prevent the dangers. First evaluation of the model. The model should be tested by actually looking at its predictions and seeing if they are true. In statistics this is done through control groups. In data science this is done through holdout test sets. And in her case studies, she points out this is not done. Next, compare the model input data set to the population that will be applied. Again, she regularly points out where this is not done. A third one is the well known make sure that you are not using machine learning to perpetuate an undesirable status quo. (but this argument is too easy)

Read this at a book club at work. It spurred a great discussion, that has carried over into other conversations. Definitely recommended to those involved in data science/analytics where people are impacted, and in areas where data analysis is becoming a bigger part of life, so as someone who works with the results of analysis you can ask good question, both while the analysis is planned and performed, and in understanding and questioning the results.

View all my reviews

Thursday, July 09, 2015

Data Manipulation with R by Spector: Book Review

Data Manipulation with RData Manipulation with R by Phil Spector
My rating: 4 of 5 stars

The quality that programming language based data analysis environments have that menu driven or batch environments do not is the ability to manipulate data. That means transforming data into usable forms, but it also means cleaning data, manipulating text, transforming data formats, and extracting data from free text. While R falls into this category of data analysis environment, almost all of the available material focuses on the application of statistical methods in R. This fills a much needed niche in how to process data. I still do not regard R as my goto tool for data manipulation, but this book means I am more likely to stay in R than otherwise. I used this as a textbook in a lower division data analysis course and the class went from a group that only half remembers Matlab to being able to process and analyze fairly large datasets. A comment I received was "I looked back on the work done in this project and I cannot believe I actually did that!"

The first part of the book is reading in data and writing out results. It discusses both text (csv, delimited, fixed) and working with relational database. One note is that the database they use is MySQL. This was easily convertible to SQLite, which is what I used in my class because my students are not IT savvy. I also used supplementary material for SQL (which is readily available) Then putting things together into data frames.

Next are a series of data types: datetimes, factors, numbers. For people who have only worked in Excel, these are deal breakers. Even using Excel, these are areas that often go unnoticed by students and lead to problems.

Character manipulation is about working with strings and a gentle introduction to regular expressions. For many of my students, they have never manipulated text programmaticly before, so this chapter was quite successful. For Regular expressions, well it provided a taste of it, enough to solve the lab assignment. I supplemented it with other material, but noone was going to learn regular expressions in 5 pages.

The best part of the book was the sections on aggregating and reshaping data. This is what made what my students were doing with R start to look like magic. Aggregations using the apply family of functions, reshape to convert data into long or wide formats, combining data frames, and an introduction to vectorization. This is not going to make anyone a functional programmer, but these are key idioms and Spector spent a lot of time here.

I am not going to prefer R over Python for working with text and manipulating data, but Data Manipulation with R shows how to do some non-obvious things. The examples are all interesting enough to be useful, and they all work as is. And this goes deep enough into some pretty powerful capabilities that expanded my students understanding of what is possible. While it is becoming dated (an update would have to include dplyr), the approaches it provides put the reader well on their way to being an accomplished R programmer, not just someone who feeds data into functions.

View all my reviews

Thursday, June 18, 2015

Applied Predictive Modeling By Kuhn and Johnson: Book Review

Applied Predictive ModelingApplied Predictive Modeling by Max Kuhn
My rating: 5 of 5 stars

I regard this as a more applied counterpart to more methodology oriented resources like Elements of Statistical Learning. So it applies machine learning methods that are found in readily available R libraries. In addition, the author is also the lead on the caret package in R, which provides a consistent interface between a large number of the common machine learning packages.

1. Built around case studies that are woven through the text. For each chapter, the math/stats is developed first, then the computational example is at the end, so that the example can develop data manipulation, application of method, then model evaluation. I like this as it allows for more complex and messy data sets than when using a new, small example for each problem. Also allows for better discussions when illustrating the differences between methods.
2. Data manipulation/data processing is given a separate chapter early on. I appreciate the attention given to working with the data (e.g. missing value imputation). There are other resources in data handling, but not in the same place as those that address the statistics methodology.
3. Emphasis on model evaluation. There is an early chapter devoted to model evaluation. Then each major section of the book has an early chapter devoted to model evaluation of that class of problem. This is in contrast to many books that are built around types of algorithms, and model evaluation is fit in. Methods and algorithms are relatively easy compared to the thought process of determining what is the right thing to do. It figures that this book will be strong in model evaluation when one of the authors is the lead on the caret package in R.

I used this as a supplement in teaching a data science course that I use a range of different resources because I need to cover working with data, model evaluation, and machine learning methods. The next time I teach this course, I will use only this book because it covers all of these aspects of the field.

View all my reviews

Friday, May 16, 2014

Notes from teaching data science for the first time

Drew Conway Data Science Venn Diagam
I spent this past semester teaching a course in data science. While there has been a data mining course taught in the department, it is offered irregularly and had a different focus.  The premise for the course I taught was that data science was the intersection of data hacking, mathematical and statistical methods, and domain knowledge (with props to Drew Conway). The students I had generally had little to no programming experience (or meaningless background). All have had a first course in statistics.

I used two texts. First was Stanton Introduction to Data Science, which is used in the Syracuse Data Science certificate program.  Second was Introduction to Data Mining with R by Luis Turgo.  All of the students were also told to go through Introduction to R prior to the beginning of the course (or as early as possible).

The class started off going through Introduction to Data Science, which included a few introductory chapters to data analysis, and introduction to R and the R Studio IDE.  Then were chapters on some basic methods at the basic level such as text processing, review of regression.  Then additional methods such as association rules and support vector machines.  We then switched to Data Mining with R which were a series of case studies.  Each case study had some form of data munging (manipulation) required, with the first one having an involved demonstration of how to handle missing values, either determining the correct value or removing as appropriate.  Each case also had a lengthy discussion of the methodologies used, with what each is being used for and a basic understanding of how it worked and its implementation using libraries in use with R (there is a book package, but it has mostly data sets and some functions to assist in data manipulation and visualization.

The assignments were built around individual projects. Their were three presentations, exploratory data analysis, preliminary data analysis, then final. The first two they could work together, but the final one had to be solo as they needed to have individual topics (even if they used the same data sets). The intent was that these assignments would build towards a final goal (but they had flexibility to bail if they wanted to mid-semester.

Probably 1/4 of the students found projects off of Kaggle, which is useful because it has a nice complex data set and comes with a legitimate question.  Another 1/4 of the students used public health as a motivating area (University of Pittsburgh is home to Project Tycho, which is a rich dataset of infectious disease in the U.S., also, there is a joint program with the Department of Industrial Engineering and the School of Public Health).

Some problems that came up. First, I discovered that many of the students had an operating assumption that all data was normally distributed, and they constantly made claims that their data was normal. Even when the data was noticeably skewed.  This was embarrassing when they would make statistical tests, and the test graphic would include the corresponding normal approximation which was nowhere near the data. I eventually figured out that for many of them, when they took statistics they were constantly fitting normal distributions in their homework data sets, so I explained that their textbook problems were written so that their would be a normal distribution to find.

Another problem was the lack of a hypothesis.  Many students started to pick problems that could be solved through linear regression and declared that because it met a p-value criteria they were done. (and in some cases, I recognized the data set as being a teaching data set). But even though they could fit a regression, there was no theory on why the data related in a given way. Essentially, they were pushing data through an algorithm without any subject understanding.  Most (not all) of them got the ideas by the end of the second presentation.

A third difficulty was skipping the model evaluation.  Most of the methods covered have some parameter that was the analysts choice, so they should have explained how they chose the value of that parameter.  Generally, this should have been a discussion of making the tradeoff between closely approximating the observed data and overfitting.  Some students skipped this completely (essentially, this is what would happen if you fed data to an algorithm then reported the result using all default values)

One big observation I had by the first presentation was being able to identify the level of programming ability by the choice of projects.  I strongly suspect that a number of students were minimizing the programming required.  But that became reflected in the level of ambition of the projects.  Non-programmers tended to choose simplistic data sets with little variety.  I think the difference is the workload.  People who could program were able to slice the data available on a multitude of dimensions without regard to scale, since the computer would do all the repetitious work, while those who could not program generally were reluctant to have large sample populations or multiple data sets on the same population.

Things for next time.  First, impress on them the need to learn to program.  Essentially, the projects from those who could program were so much richer than those who could not (even at a low level of programming skill) that I was embarrassed for those who could not program.  Second, I should push harder on the need to have a hypothesis that was driven by domain understanding of the problem. This should be pushed harder from the very beginning to discourage people from merely pushing data through statistical methods and reporting results.

For teaching data mining, I think that the organization of the course needs more methods focus. The principle text was case driven, but that meant that methods were being introduced in a fairly arbitrary sequence.  I ended up doing a methodology focused review over the last few weeks. What I should do next times is after the introductory section (Stanton Introduction to Data Science), have the next several lectures be a tour of the classes of data mining methods (regression, classification, clustering, feature selection), then do the case studies.  One resource I found useful in this are articles from the Journal of Statistical Software, many of which are focused on R packages that implement classes of methods.

This was a very good course. I wished that the students did more participation (by the final presentation, there were some points that were given based on shear quantity of comments, which several students took advantage of). Some of the projects were much more ambitious than any other done in the MS program. And I have a lot stronger argument about the need for the graduate students to know scientific programming as a skill set.

Sunday, February 16, 2014

Mining the Social Web, 2nd ed by Matthew Russell: Book review

Mining the Social Web: Data Mining Facebook, Twitter, LinkedIn, Google+, GitHub, and MoreMining the Social Web: Data Mining Facebook, Twitter, LinkedIn, Google+, GitHub, and More by Matthew A. Russell
My rating: 4 of 5 stars

The hardest part of learning a data analysis method is not in implementing the method, it is applying the method in the context of a real data problem. And data mining and machine learning texts often skirt the issue by using pre-processed data sets and problems defined to fit the method being taught. Russell uses analysis of social media sites to set a context where you start from having to gain access to real data sets, clean and transform the data into forms that your analytical libraries can make sense of, and then use the results to make a conclusion. For that, it rates a place along any other text that focuses more on the analytical methodology itself.

What I most appreciated about this book was the work put into converting data from one format to another. From the beginning, when he works with data pulled using a services API, then getting that into a format that another library requires, then getting those results into a data mining framework for analysis. Following his flow has helped me understand the methods better. And these examples of processing data from format to format is something that gets my students stuck before they get really started in a project. I especially appreciated the chapters that worked with the Natural Language Toolkit (NLTK) and the NetworkX graph libraries. These examples helped me get pass what was the hard part for me in working with these libraries in previous encounters.

The virtual machine is also very helpful. I have always found the hardest part of working with Python for analytic computing has been teaching my collaborators how to get set up. And in data mining this is even harder than standard. I was able to get through his book installing everything on one machine, but on another I used the author's virtual machine, and I have pointed a student who was working with me to the virtual machine as well.

This is a great book to work through the mess of implementing data mining methods in real situations. It is not a theory book, but it serves its purpose well.

Note: I received a free electronic copy of this book from the O'Reilly Press Blogger program.
I review for the O'Reilly Reader Review Program
View all my reviews

Tuesday, January 28, 2014

Doing Data Science by O'Neil and Schutt: Book Review

Doing Data Science: Straight Talk from the FrontlineDoing Data Science: Straight Talk from the Frontline by Rachel Schutt
My rating: 4 of 5 stars

Doing Data Science is about the practice of data science, not its implementation. It is based on a course on data science that featured a guest lecturer on each topic. This leads to the guest lecturers (and chapters) focusing more on important concepts rather then the methodology. So, this is not a textbook or a how-to-do-this type of book, rather it is a how-to-think-when-doing book.

A problem with books like this where each chapter is written by someone different is the need for coherence. A second is that each author typically has something to day, and she has to say it in her chapter. So, compared to other data science books, it suffers from the chapters not building on each other in a systematic way and having multiple messages that appear as you go through the book.

One benefit from this is that each author has something to say. While I find the book thin on how to do things, this is a good source of wisdom in why things are done and issues that come up along the way in real life. I am teaching data science for the first time and I find myself turning here for topics of discussion which my chosen textbooks don't cover (as they have more focus on how to do things).

I don't think this is the book to use to learn how to do data science, and I suspect the students at Columbia learned how to find other sources to help them figure things out. But it provides wisdom, which is harder to find and worth quite a bit.

Note: I received a free electronic copy of this book from the publisher as par of the OReilly Bloggers program.

I review for the O'Reilly Reader Review Program

View all my reviews

Sunday, October 27, 2013

Data Points by Nathan Yue: Book review

Data Points: Visualization That Means SomethingData Points: Visualization That Means Something by Nathan Yau
My rating: 4 of 5 stars

This book is not about how to create data visualizations, it is about how you use visualizations to communicate data. In that respect it is not trying to be a book about tools, but a book on aesthetics, it focuses on how you evaluate different combinations of visualization options for communicating different types of information about data, not just a number of rules. In this respect, it goes considerably deeper and profound about how people comprehend and interpret visualizations than a set of pithy rules masquerading as common sense. In this respect, it is a successor to Tufte in an age where being able to try alternative visualizations and even having consumers interact with the visualizations is cheap.

The book is not a description of various types of visualizations, even though it has such descriptions and discussion of comparative assessments. It is a book on how to think about the message(s) you are trying to communicate, and how to do so in ways that can engage the reader at many layers of depth where simple messages are easily grasped, and complex messages can be absorbed with their relations and implications. Along the way he discusses the relative strengths of using different types of visual cues to communicate information (position, length, angle, direction, shapes, area, volume, saturation, hue), which is much deeper than saying 'bar charts are better than pie charts' (which is an argument that a post-doc tried to engage in with me once). After a brief introduction, he proceeds to show you by example after example of the comparative qualities of each cue, and also how they can be used in combination to show multiple levels of information and relationships.

One of my biggest insights from 'Data Points' is actually not discussed in the book. The book gives you the understanding you need to evaluate the range of combinations of means of presenting data. But about halfway through I realized that the discussion and philosophy of combining these visualizations has a name. Wilkinson's Grammer of Graphics. I have learned the ggplot implementation of Grammer of Graphics, and I favor it above other plotting families in R and Python as being more flexible and giving you more control over the result. The discussion in Data Points explains why Grammer of Graphics is important, it provides an interface for exploring combinations of aesthetics (visual cues) to communicate aspects of complex data sets. And with this, it will probably change how I present and teach visualization for data analysis.

View all my reviews

Wednesday, October 16, 2013

An Introduction to Data Science by Stanton: Book Review

An Introduction to Data Science by Jeffrey M. Stanton
My rating: 4 of 5 stars

This freely available book fills a nice little niche, people getting started in data analytics. The first problem people have in learning this is they tend to learn a number of techniques, but in practice they cannot get past the step of accessing and preparing the data. This book covers this and gives good practice in it. I plan on using this as the first of two texts for the course. This book will get them started (gently) in R and accessing and processing data, then a case based data mining book where they can use what they learn here to work with larger data sets that are then analyzed in the methods that the other book goes into more depth.

This book would be for those who are just getting started and need some hand holding as they get started with the R environment as well as those who don't really know where to get started with new data sources. It is most useful for those who are starting from nearly scratch, but also for those whose education included data analysis techniques, but whose training neglected those crucial steps on how to get started and why you should be using some class of method, not just the how. And since it is a free electronic book, it is a low cost way to get started.

View all my reviews

Thursday, October 10, 2013

Data Science for Business by Provost and Fawcett: Book review

Data Science for Business: What you need to know about data mining and data-analytic thinkingData Science for Business: What you need to know about data mining and data-analytic thinking by Foster Provost
My rating: 5 of 5 stars

What Provost and Fawcett have done is to write a book on data mining that focuses on the why of data mining technique, which is great complement to all the books that focus on the how of data mining. And because it focuses on the why for the myriad of methods that fall under the heading of data mining, this would be a good source for a manager of a project for which data mining was merely part of the project, or for a source of good explanations when you need to explain to others what data mining methods (or buzzwards) can and cannot do.

I've come across a number of data mining books. Some are deep into the mathematics and statistics that underlie the methods of data mining. Others focus on how you implement methods. But while this helps with technique, a missing niche is the why, or the morality of data mining methods. They go over a range of methods, but the focus is on the task, recognizing what kinds of questions can be asked in a situation, then how to answer it. This is different from a methods book that has chapters focused on PCA, SVM, trees and forests, or other techniques. The second can lead to tossing out buzzwords. This book is the first, and is for having conversations about how to get a task done.

While I've read and worked through examples from books that focused on methods and implementations, I think that my understanding of data mining has improved significantly on reading this book. I'm recommending it to a former student who has since had to learn and implement these methods in practice, so he can better explain what he has done and its significance at his company. My only nit to pick is the title.  The book clearly focuses on data mining, not on other aspects of data science. Within that realm, I recommend it unreservedly.

Disclaimer:  I received a free electronic copy of this book through the OReilly Blogger program.

View all my reviews

  I review for the O'Reilly Reader Review Program

Thursday, February 07, 2013

Review of the R Graphics Cookbook by Winston Chang

R Graphics CookbookR Graphics Cookbook by Winston Chang
My rating: 4 of 5 stars

If using the grammer of graphics as implemented in ggplot2 is like learning a new language, the R Graphics Cookbook is not a book that tries to teach you a new language, rather it is like learning a language through using it and is a different take on ggplot2 and graphics in R than other ggplot2 books.

ggplot2 has always presented itself as learning another language. And while it seems that a grammer of graphics is the right way to go I have always had a hard time getting a handle on it. But while the idea that you can build graphs through a grammer with a consistent meaning is elegant, sometimes you need to start by accomplishing a task. R Graphics Cookbook becomes very much like a phrase book you need to get started. Some of the earlier chapters cover categories of graphs and work you through the variations. Other chapters focus on the graph annotations, titles, axis, labels, etc. And since this is a grammer, you are assured that this is applicable to all of the types of graphs that were covered earlier.

Another aspect of this book that is helpful is the chapter on data munging. While this book focuses on graphics, the principle library, ggplot2, requires that data has been shaped into data frames before using it. But this becomes an overhead that I'm not used to coming from other graphics and plotting paradigms such as in Matlab, Python, Excel, etc. So the chapter on getting data into shape is important. This includes creating data frames, creating new data frames for purposes of generating graphics, and modifying data frames so that they yield more elegant graphics.

I still think I will have to understand the gglot2 book to understand the grammer of graphics in detail, but this book is better for me to get work done, and may make the difference between using ggplot with its elegance rather than other graphics libraries that I use when I get frustrated by the overhead to get started.

View all my reviews

 I review for the O'Reilly Blogger Review Program

Sunday, December 30, 2012

Book review of Statistics in a Nutshell 2nd ed. by Sarah Boslaugh

Statistics in a NutshellStatistics in a Nutshell by Sarah Boslaugh
My rating: 4 of 5 stars

One of the biggest problems faced in teaching statistics is the gap between learning the methods to actually using them. Statistics classes that are based on learning formulas fail due to the disconnect between learning formulas and the reality that very rarely are these methods used by implementing the formulas that are so painstakingly taught. But learning statistics as a set of steps or functions in a computer package only gets a little further. The real goal should be what methods should be used and why. The how is almost secondary. Statistics in a Nutshell focuses on the what and the why. I would not use this to learn how to perform a technique or its formulas, but this is where to go to understanding how the various methods of statistical analysis should be used and their qualities. It is meant to be read, not just studied, and as such it holds a different place than other statistics texts.

When I first learned statistics, the focus was on learning formulas that calculated various values. But the problems I could work on were only toys, and it took so long that we did not get into much of understanding what we were dong. Now with readily available software packages, the temptation is to focus on the mechanics of implementing a procedure on a set of data and reading the computer output. But software documentation and even books that teach statistics fall into the trap of focusing on how a method works then applying it and not as much on why. Part of this is because of the pressure of having to cover topics, but the fact that the methods are presented in isolation, without their application context so it is rare to grapple with the question of how to know what needs to be done and instead the focus is on how to do it.

Statistics in a Nutshell is the other kind of book. I was taught that for computer programming for any language you wanted a book that focused on methods, but also a book that focused on morals, the why you use a language feature. This is the morals book for statistical programming. You read it, not to learn how to calculate statistical output or implement visualizations, but to think about what method or visualization is appropriate to help understand the data and environment and to communicate those truths to an audience.

Because of the expectation that any course that teaches statistics gives the students a toolkit, this would never be a good book for teaching a course. But in the real world, what is more important is that you understand what these statistical methods are and why you use one over the other. So for the data analyst or a student who needs an overview of everything this is ideal. It would also be ideal for someone who may not have the time to go into detailed study of statistical methods, but needs to interpret the results or work with statisticians and data analysts. This book will help interpret what you get and ask the right questions to both understand statistical results and perhaps point those who are doing the analysis in the right direction so that they are answering the right questions.

Note: I received a free electronic copy of Statistics in a Nutshell through the O'Reilly Press Bloggers program.

View all my reviews
I review for the O'Reilly Blogger Review Program

Saturday, December 22, 2012

Engineers can read! A book review of Against the Gods by Peter Bernstein

Against the Gods: The Remarkable Story of RiskAgainst the Gods: The Remarkable Story of Risk by Peter L. Bernstein
My rating: 4 of 5 stars

One problem with the teaching of math and statistics as practiced in the U.S. is that it often seems like a series of topics that are sprung out of whole cloth with no context. Against the Gods has two parts: a history of how views of risk developed within western civilization and then a examination of the tools and (mis)use of risk managements in modern finance. In doing so it paints a picture of not only what the principles of probability and risk management are, but why they were developed and how they are used (and misused).

I had assigned this book as part of a course in decision analysis within an engineering department to a mix of upperclassmen and graduate students. Most found the first have to be fairly uninteresting. But the payoff came later as Bernstein tracked the growth of the development of probability to its application in insurance then to financial instruments in general By the end of the book we were discussing the purpose of modern financial instruments in terms of risk management using both modern examples and the 15th century patrons of renaissance explorers. And seeing how not understanding the principles and purposes behind the techniques leads to trouble, many of my students said the book gave a greater appreciation for the probability and statistics they have been learning.

And a gratifying note, in their report, many of the students stated that they did not read outside of their technical books, but after this experience they developed an appreciation for non-fiction and planned on looking for more such books to read in the years to come.

View all my reviews

Friday, November 09, 2012

Book Review: Python for Data Analysis by Wes McKinney

Python for Data AnalysisPython for Data Analysis by Wes McKinney
My rating: 5 of 5 stars

For some time now I have been using R and Python for data analysis. And I have long ago discovered the Python technical stack of ipython, NumPy, Scipy, and Matplotlib and I thought I knew what I was doing. I even dipped my toe into pandas as my data structure for analysis. But Python for Data Analysis showed me entire worlds of improvement in my workflow and my ability to work with data in the messy form that is found in the real world.

Python, like most interpreted languages, is slow compared to compiled languages. But there is a technical stack that started with the NumPy libraries and has grown to include Scipy, Matplotlib (graphing), ipython (shell) and pandas you get high quality and fast algorithm and data structure Fortran and C libraries underneath Python. But while these libraries are designed to be used together, documentation tends to be only about one at a time, and very little puts it all together as an integrated whole. McKinney's Python for Data Analysis fills that gap.

Even though I have been using iPython, NumPy, Scipy and Matplotlib for years, and pandas for about half a year, going through this book makes me feel like I was a rank novice. I learned how to efficiently use the shell as a development tool, to the point I have stopped automatically using the ipython notebook or pydev (eclipse) when starting new projects and I use the shell instead, because its introspection and debugging capabilities made it much easier to work. I had started using pandas for a data structure because I liked the similarities with R data frames, this book showed me where pandas goes well beyond that. With matplotlib I could make specific plots, this book showed me how to use the pandas interface to make them a natural part of the workflow (even if it is not yet at the level of a grammer such as ggplots)

Python for Data Analysis does not just teach how to use the Python scientific stack, it also teaches a workflow for technical computing. And this is beyond what you can get from reading off the web, it probably really requires the opportunity to work alongside someone who knows what they are doing to see the practices that makes them productive. As such, I would recommend it for anyone who does scientific and technical computing, whether in the sciences, engineering, finance, or other areas where quantitative computing using Python is done.

Disclaimer: I received a free electronic copy of this book from the O'Reilly Blogger Program.

View all my reviews

I review for the O'Reilly Blogger Review Program

Saturday, March 24, 2012

Book Review: Machine Learning for Hackers by Conway and White

Machine Learning for HackersMachine Learning for Hackers by Drew Conway
My rating: 5 of 5 stars

Machine Learning for Hackers is not a reference book or a standard programming tutorial on machine learning. For references, you go to Hastie, Tibshirani,and Friedman's 'The Elements of Statistical Learning.' For tutorials, there are a fair number of sources that could walk you through the use of regression, data exploration, classifiers, principle component analysis, etc functions in R. But what MLfH gives you are Drew Conway and John Myles White. And they don't teach skills, they are passing on wisdom of how to work with data, how data needs to be explored, understood, manipulated, and finally, using machine learning methods to gain understanding.

In computer modeling in general and data analysis in particular, one thing that is often hard to convey is that the purpose of computing is not numbers, but insight. The effects of this problem is seen in graduate from even the best schools knowing how to drive a computer program, but not knowing how to interpret results or how to ask a question, then taking the results from that and asking the next question. The course we teach and the texts that we use do not help. Our courses are each siloed to present a distinct portion of the total body of knowledge. Textbooks are often either theoretical or intended to provide a glimpse of application, but always in bounded chunks. Computer application books are often built around the capabilities of program in question, but often stop at the edge of the capabilities of the application or environment in question. What is needed is not to tech methods or tools, but to teach wisdom. The ideal is to be able to sit side by side with an expert who can walk through a data set and ask questions, get answers, and to think about what to do next, whether the answer is what was expected or not.

This is what Conway and White do. For each topic, they open up with a discussion of the problem type and the tools, and sometimes with a toy example. But then they go through a substantive example. And the narrative text is where they shine. They take a messy dataset (often the publicly available/accessible form) and work through what needs to be massaged to get it into useable form. Next is processing the data into the R data type needed for the analysis. Then initial exploratory steps where you gain understanding of problem, and how to analyze it, finally analysis and presentation.

I've been taught that in learning a programming language, it is often beneficial to have two books for reference (other than tutorials), one that is a proper reference (i.e. how to do something), and one a morality reference, how you should approach doing something. In data analysis, you should know the theory/methodology and how to use the tools at hand to apply the methodology, but also how to think about problems. And short of an apprenticeship with a master, MLfH does very well in this.

Disclaimer: I received a free electronic copy of this book from the OReilly Blogger Program. More information on this book can be found at the book web site.
I review for the O'Reilly Blogger Review Program

Tuesday, September 20, 2011

Book Review: Think Stats by Allen Downey

Think StatsThink Stats by Allen B. Downey
My rating: 4 of 5 stars

Statistics gets a little respect in Operations research, in part because it gets taught as a bunch of formulas and computer procedures. And the problem with the way that it is taught is that the formulas don't mean anything, and the student may know her way around menus, but that does not mean that she knows under what circumstances to use what method. And everything is learned in isolation, often without practice in getting her hands dirty. Think Stats gives students the chance to get their hands dirty.

Because it uses a programming language (Python) it covers data analysis from beginning to end: viewing data, calculating descriptive statistics, identifying outliers, describing data using the distributions (and explaining what the distributions really mean!). Going through this small book, the goal is understanding and using statistics, not just learning statistics. I have a number of college undergraduate students working on projects. I have started giving them this to work on when they first start with me, both for the programming in Python and to learn statistics and data analysis so they can be useful.

I received a free electronic copy of Think Stats from the O'Reilly Blogger review program.

View all my reviews

Friday, August 12, 2011

Alternatives to the scientific method

I've been taking some time over the past two weeks having lunch with some students who were working with me for the summer. As part of this, I ask them what they thought about the experience of working with researchers and their own roles. I also discuss the project and where what they did fit into the overall goals.

One thing that surprised them all was that there was an alternative to decision-making through the use of models and analysis. And that using models and rigorous analysis was not always accepted or desired as a way of understanding our world and making decisions. Even important and complex ones.

1. Analysis by argument/logic - There is a reason that study of the natural world (what is now science) used to be called natural philosophy. This is analysis through reasoning and providing explanations for observed phenomena.

2. Perception as truth - The belief that what is perceived is what is true. This was argued by a number of friends of mine in graduate school who were members of a faith based group. It also is the justification of truth being arbitrated by those with societal power.

The contrast is the scientific method, which involves

i. Propose a hypothesis
ii. Identify a consequence from the hypothesis
iii. Develop and conduct an experiment that can test the consequence and potentially disprove the hypothesis
iv. Revise the hypothesis

Why would someone use (1) or (2) in making decisions instead of the scientific method?

a. Easier. (1) or (2) can be done much faster.
b. Lack of capability. Utilizing the scientific method required personel who are trained in developing hypothesis, identifying consequences, and designing experiments to test the hypothesis in the domain in question.
c. Power. (1) and (2) can be used by those who have built up power in a domain. Related to (a)
d. Disbelief. A large segment of society does not believe in the scientific method and prefers other sources for establishing truth.

(a) and (b) tend to be the basis of outreach by analytical groups within companies and academics. They often run into (c), which is subverted when top leadership has experience with having analytical groups assist decision makers in the past (one common example is if an executive served in the U.S. military) (d) tends to be the target of groups such as the American Association for the Advancement of Science (AAAS), the National Academy of Sciences (NAS) or more politically oriented groups such as the Ben Franklin's List (see New York Times, August 8, 2011, Groups Call for Scientists to Engage the Body Politic)

In large part those of us who are trained and teach and use the scientific method forget that there are alternatives, and people choose to follow those alternatives for reasons. I think that working with the high school students who don't worry about sounding ignorant (after all, they are going to go on with their lives, and there is never any shame for a high school student to tell a college professor in private that they don't understand something)

Sunday, July 03, 2011

Review: Sage: Beginner's Guide by Craig Finch

Sage Beginner's GuideSage Beginner's Guide by Craig Finch

My rating: 4 of 5 stars


I like to use Python for modeling and data analysis, and I tell my students that I consider Matlab, R and Python moral equivalents, made in kind by their wrapping of various numerical Fortran libraries, data structures for matrices and vectors, and numerous specialized libraries. But while there are Matlab books for every combination of field and level, and R books for every branch of statistics under the sun, Python books for data analysis are rare. Most introduction books are aimed at computer administrators or web programmers. Material on the web for scientists tended to be reference material that explained the functions available. The few in depth books seemed to assume that you were already a competent scientific programmer who was adding a new language to the toolkit. Sage: Beginner's Guide is meant for the person who is learning scientific programming, and doing so using Sage. As such it is highly useful for those who are being introduced to scientific computing in Python world.

While I use Sage and Python in technical programming myself, I have not been able to successfully teach someone else to do the same. What Finch does is to introduce someone not only to tools available for Python programmers, but instructions on setting up the environment, the practice of technical programming, but also the idea that each of these steps sets up something else.

Sage is a large and highly capable program, so any book has to focus somewhere. So the chapters can be thought of as covering the following (Note: this is NOT a chapter listing):


  • Introduction and installation of Sage

  • Use of Sage as an interactive environment

  • Python programming: Introductory and advanced programming

  • Numerical methods: Linear algebra, solving equations, numeric integration, ODE

  • Symbolic math: algebra and calculus

  • Plotting: 2D and 3D


In each substantive chapter, topics are covered in a standard pattern. A brief narrative description, a short sample program that uses the concept, a description of what program does and why the output looks like it does, then sometimes there are exercises that you can use to confirm you understand the concept or build your intuitive understanding.

What is missing? These are probably additional topics for "Where do we go from here" chapter. First, they do not take advantage of the Python ecosystem. Because of the basics of Numpy, Scipy and Matplotlib, numerous other scientific libraries exist that are not in Sage. I would include some notes on installing packages for use in Sage (which requires some modifications to the standard procedures). Also, an explicit mention of Scipy, since it is the basis for a number of other scientific packages in Python.

Sage: Beginner's Guide is a great addition to the library. It fills the role of the introduction to technical programming in Python that for Matlab is filled by professors who teach computational science/engineering courses. I envision that my copy of the book will be loaned out to one student after another for some time to come.


View all my reviews

Note: I received a free copy of Sage Beginner's Guide for review from Packt Publishing.

Monday, December 27, 2010

Book Review: Data Analysis with Open Source Tools by Philipp Janert

Data Analysis with Open Source ToolsData Analysis with Open Source Tools by Philipp K Janert

My rating: 5 of 5 stars


This is a book that is how to think about data analysis, not only how to perform data analysis. Like a good data analysis, Janert's book is about insight and comprehension, not computation. And because of this it should be a part of any analysts bookshelf, set apart from all the books that merely teach tools and techniques.

The practice of data analysis can get a bad rap, especially by those who think that data analysis is only statistics. Most books on data analysis don’t help because they focus on using the features of a particular tool, leading to the view that data analysis is following a recipe from a cookbook. This book subverts this by being principally of how to think about data analysis, and providing examples using different tools (primarily R and Python, but he uses other examples as well)

Among other topics, Janert covers graphing, single and multi-variable analysis, probability, data modeling, statistics, simulation, component analysis, reporting, financial modeling and predictive analytics. In each section he starts by explaining the concepts, what it is for, and (just as important) what each topic is not. Working through it you get a sense of not just what and how of the various tools and methods discussed, but why they are used as well as some ways these techniques are misapplied.

Janert also illustrates the methods using some data analysis environments. Principally R and Python (with Numpy, Scipy and Matplotlib), but also other tools such as Gnuplot and the Gnu Scientific Library. What is helpful here is the focus is on what techniques and capabilities are needed in the tool, not the tool itself. Instead of being a cheerleader for a particular tool, Janert discusses in his appendix the qualities that make environments such as Matlab, R and Python good data analysis environments. However, this focus means that he does not teach any particular tool. If you want to learn how to use a particular tool for data analysis, you are better off getting a book on R or Python (or Matlab, Excel, etc.)


The book page at O'Reilly.com is here: Data Analysis with Open Source Tools


I review for the O'Reilly Blogger Review Program


View all my reviews

Sunday, December 19, 2010

Lessons Observed: Learning Bayesian Methods

I've been working with one of my students in a project that involves identifying a proper probability distribution and parameters for a fairly complex and diverse data set. As we did our literature review, one thing that was very unsatisfying was the fact that many published papers either used data that was unavailable at the time needed, or employed magic numbers as part of their method (magic numbers are arbitrarily chosen constants). As she did her literature review, we discovered the applications of Bayesian methods. But neither of us had any experience in using this. At the same time, my PhD student had a problem that we uncovered during his proposal presentation. He needed another course. Solution. We'll have an independent study on Bayesian methods with three of us.

We used as a basic text Carlin and Louis, Bayesian Methods for Data Analysis and Alberts, Bayesian Computation with R as a supplementary text. The alternative to Carlin and Louis would be Gelman et. al., Bayesian Data Analysis. We chose the Carlin and Louis text because it seemed to be more technical while Gelman et. al. was aimed at social scientists (as opposed to the mathematical disciplines we came from). (Note: all of these do require some level of programming using R)

While doing this we were also looking at various Markov Chain Monte Carlo (MCMC) toolkits. The best programmer was working with MCMCPack. The least experienced used WinBUGS and I used JAGS.

Lessons learned:

1. For independent study, I should be more forceful on making them do the exercises. By the time we were done, I had implemented many of the models, but I don't think my students did.

2. Carlin was good to work with. I had gotten the instructors solutions guide direct from him (although I did not use it). I also identified a problem in one of the data files for one of the case studies.

3. Of the three of us, JAGS was the only one we got to work well. We had a hard time formulating models in MCMCPack. WinBUGS would work, but it was only good for interactive use (if you called it from R, it would open its own window to do its work, which is a lot of overhead) and we needed something that could be used as a callable library because we needed to apply this to 1000's of cases.

4. There was a benefit to involving my students in learning this field. Because I knew nothing about it, I could model the process of learning a new field of knowledge to my students.

Outcomes

1. The project is turning out to be successful. We're doing comparative performance evaluation now and it does considerably better then the other methods in the literature. The fact that Bayesian methods blend expert knowledge and historical data in a systematic way gives it considerable face validity.

2. The student that I was working with is going back to her home university with an expectation that she will introduce Bayesian methods to faculty and other grad students in her statistics department (at a university outside the U.S.)

All in all, I think this experience was successful. Not that I am an expert in Bayesian methods, but this has led to very good results that I expect to see implemented on live data in the near future. And some insights on situations that allow Bayesian methods to be more useful then most applications of it.