Showing posts with label data science. Show all posts

Sunday, February 01, 2026

What is needed to work in the age of Generative AI

Last week I was at CMU-Heinz for a fireside chat type event with students in the various MS in Analytics programs there. One question that I got was what were the skills needed to succeed in an environment with AI, and even into the future.  Then I spoke about being able to program because you need to learn how to think deliberately, being able to connect technical capabilities with end business needs (because this has always been how analytics fails), and as I think about it more having a better understanding of knowledge. Because if you believe that your education and training is about learning sets of facts and recipes, AI will eat you alive. So your understanding of your field has to be greater than facts and procedures.


First, why learn computer programming when AI can write code faster than you. Microsoft has a set of studies showing a high (40%) rate of errors, yet their programmers also say they are more productive. Because, as I use AI at work, I find that it is helpful in creating good structure and framework scaffolding, especially when I have to context switch (I regularly switch between three data stacks at work, each of them have many people who spend all their time in one) or if I am applying methodologies new to me or my organization.  But because I am competent, I can correct it as I go, and the fact that there were originally errors is not a big concern, because I was going to revise everything anyway


Another reason to learn programming is you learn to think in a different way. The ancient Greek philosophers had students learn geometry before philosophy. Not because geometry and math is beautiful (even though they are), but because with geometry comes proofs. And geometric proofs is about how much you can understand starting with a minimum amount of assumptions (Euclid's five axioms). And you now have experience in determining an objective truth, no appeals to authority, no claims of different point of view. And your logic is in the open, to be critiqued on their own merits. Far different from my friend in grad school who claimed that perception is reality. And only then were you fit to move into the realm of ideas, where even facts have to be evaluated.


Programming languages differ from natural languages in their precision. Every statement has a single clear meaning. And this is different than natural languages, where the ambiguity of human life plays a role. So to work with anything regarding computers, it is helpful to recognize that computers will work with language in different ways we do, it handles ambiguity differently than people, and how it will use randomness to handle the difference (which is key to how Generative AI works).


The next is the link between the capabilities of technology and the needs of the business.  According to everyone who has studied project failures in depth, failed communications between the business partner and the analysts is the biggest cause of project failure. And data projects have a failure rate between 80-90% (this range has been persistent in studies over decades in the data world, and it is consistent across definitions of failure and different segments in data analytics, data engineering, or data reporting (dashboards)). Being able to understand the business needs of end customers as well as understanding potential classes of technology solutions leads to asking better questions and getting value out of the applications of technology.  The main reason for breakdowns in communication is ego and arrogance.  From the technology side, there is often a belief that the customers are idiots who do not know what they want, so the technology people should just build something and pitch it back to the customers.  This is mirrored by business people who think that technology is a a turnkey product so they should not interact with the people who are creating the solution.  A third variation is when upper leadership decides to act as an intermediary between the analysts and the end customer. The logic here is generally that the leader believes both the technologists/analysts and the end customer have no communications skills, therefore the leader will handle all of the communications and give the requirements to the analysts.  All of these are wrong. Especially in anything involving data, details matter, and the entire project involves discovery of details that no-one realized were important at the beginning. So the analyst and the end customer need to be regularly reviewing these discoveries, and adapting along the way.  And only the end customer (because they are closest to the problem on the ground and know what kinds of actions can be taken) and the analyst (because they will be representing the detail in models and they know what the range of alternative models can do) together can make those decisions.  Without that direct communication (potentially facilitated by someone who knows both sides), a project falls into the trap of solving the wrong problem. And this requires people who understand purpose and can determine the impact of nuance, both of which Generative AI does badly in.


The third category of future work is understanding your field.  Computers are very good at retrieving facts, if those facts are in its knowledge base. Gen AI is better than prior technologies because it is not as sensitive to getting the wording precise.  Computers are also very good at following instructions if those instructions are given. (people also tend to be better at things when they are given good instructions). So, if this is the extent of your subject expertise, you are in trouble.  In software development, there is actually a very large workforce like this, whose careers are built on the ability to fill out a given framework or instructions. But if your place in the world is built on more than knowing facts or following recipes, if there is actual understanding that has to be applied on a situation specific basis, there is still room for you. Without that understanding, an organization can execute perfectly, a solution to the wrong problem. Which is worthless. So you need the level of understanding that allows for good judgement, and you need to be working in an organization that allows for its employees to use that judgement.


A last criteria is based on a number of conversations I've had.  Many people express that they believe in the answers Generative AI gives because of the massive investment these companies have made, the smart people they have hired, and the belief that these companies would ensure correctness. I had to explain that these are industries and communities that have historically claimed they had no interest in accuracy or correctness. And until recently, viewed the paying customer as king and only sought to full the demand. Ethics was not part of the conversation.  And what they delivered, did not come with guarantees other than it does what it does.  This attitude that you did not question the authority that came with wealth and success is the first thing that has to be broken before people can use Gen AI productively.  Both of my kids do it.  I design the rollout and presentation of projects at work to make sure my business partners who are using Gen AI view its output skeptically and looking for specific types of flaws.  As an avid reader of science fiction over the years, much of which addresses AI as part of society, and worry much less about the power of AI than I do about people who use the output of AI without being critical thinking. It is the kind of following that leads people to enact policies without analysis, and punishes people. And the outcomes are the fault of the people who followed the AI. Because AI has no goals, purpose, or conscience beyond that of its user.

Sunday, July 13, 2025

Adventures in core.logic: learning clojure and logic programming with help from Gen AI


This past month my project has been to learn logic programming, and as a vehicle to do this, learn clojure (again).  For those who are not computer scientists, logic programming is one of the four main computer programming paradigms:  procedural (what most people learn in an introductory programming class), object oriented (what most computer science programs and professional programmers aim for, Java, C++, C#, Ruby are all examples of OO languages), functional programming (Lisp and its relatives), and logic programming.  The closest most people get to logic programming is SQL, which is declarative and works by expressing the outcome, but not the steps to get there.  The most well known language is Prolog.  A more recent expression of logic programming, is miniKanren, which is a Domain Specific Language originally implemented in Scheme, but there are other implementations, whose quality seems to be related to how well functional programming is implemented in those languages.  This essay looks at (1) learning clojure (a Lisp that runs on the java virtual machine, (2) learning logic programming (3) learning core.logic, which is the implementation of miniKanren on clojure, and (4) using Generative AI to help with all these things.

This is my second exposure to Clojure, which is a Lisp (a functional programming language) that runs on the Java Virtual Machine. The big draw is that it provides a functional programming way of working that allows use of all Java libraries.  As a data scientist, the advantage of functional programming is that this is a much better style of programming when doing data manipulation. For example, using R with the tidyverse is functional style programming in that you perform operations on data frames that return data frames, and this allows the use of piping/sequencing of functions that conform to this pattern. (Pandas in Python is a flawed version of this as not all functions in Pandas follows this rule)

My first run with Clojure was around 2014 (so says my Github timeline). At the time the Incanter project was trying to establish it as a data analysis environment on the JVM. With the goal of being used in corporate IT departments that had standardized on the JVM (which places obsticals to using Python or R).  And it was good enough that I had written a model and associated analysis in Clojure for an attempted startup (a clean implementation which was not done at any of our home organizations). But the Incanter project stalled. And more recently a broader effort to provide data analysis/scientific computing capabilities into Clojure shows promise. Scicloj.  One standard mantra that I can confirm.  Lisp makes the claim that it has very little syntax, it is easy to learn.  And I would agree. After almost 10 years, a short online course and a review of some books I had from 10 years ago I was pretty up to speed.  Because when everything is a list, the question then becomes what is the form of that list for the task/function/library at hand.  Which is easier than any other language that I work with where I have to learn the philosophy of every package I use. (or collection in the case of the tidyverse on R).  In addition, the tooling was easier. Visual Studio Code has the Calva extension, which makes working with Clojure projects automatic (pretty much anything on the Java virtual machine needs an IDE to handle the project setup, so a good IDE is essential.)

For learning logic programming, I started with some Prolog materials, because that would allow me to focus on the logic and thinking part (Prolog is also fairly sparse in syntax).   I got Adventure in Prolog by Dennis Merritt and followed along with implementing the Nani adventure game as well as the geneology exercise that was developed over the entire book.  But I was always going to move to miniKanren, becuase in any conceivable use, I would be integrating logic programming into something else.

My first two attempts to moving from Prolog to a programming language were with Julia and Clojure.  With Julia, there was Julog (which is attempt to follow Prolog patterns but in the Julia language). This seemed servicable, although all I did was the adventure game. Then I looked at the miniKanren projects.  All of them were the beginnings of an implementation, but not complete enough to do anythihng.  (Scheme and miniKanren both have a reputation for being the target of a budding language creator's first target because they are so simple to write, but then the said creator's attention goes somewhere else).  And even though I have also used Julia in the past, I basically had to learn it over again as it changes every version (I review books by computer publishers, so I have had a chance to look at Julia every now and then, and it does feel like I'm starting over again every time).

Clojure has the advantage the the main language is very stable (and since it is a Lisp it has the advantage of having seen the history of language decisions, good and bad).  They have a fun graphic where the show the history of the source code changing which looks like layers instead of comparable graphics for other language projects that look like landslides.  But the same cannot be said about core.logic.  When core.logic first came out it was a unique in the sense that it was an implementation of logic programming that was in a relatively mainstream computing environment (because logic programming makes a lot more sense on a Lisp type programming environment than on a Algol type object oriented/procedural programming environment).  So there are a lot of early tutorials. But around version 0.8.5 or so there was a major change in the core.logic library organization, and a sub library was created to hold all of the non-logic things. Which includes things like facts and data.  But this broke all of the tutorials. And like faddish things, noone updated their tutorials. So all of the tutorials that everyone points to was from 0.7.6 or so. So as I repeated the Adventure in Prolog exercises, the getting started introduction was easy, but I had to discover that there was a new way of doing things that involved actual data (as opposed to being logic exercises) and I redid the Nani adventure and the bird expert system using the new core.logic and core.logic.pldb structure.  

The bird expert system exercise was particularly difficult. I actually did not do this set of exercises when I went through the Adventure in Prolog book (because it did not actually start until about halfway through).  So I tried to start from someone else's Prolog solution.  And that completely failed.  So I used OpenAI's ChatGPT and Google Gemini to help me. So neither of them completely got it right, but they got me on the right track. So my solution does not look anything like the Prolog solution. And the types of mistakes that the Gen AI did were interesting.

Generative AI works by going through the training data (essentially the internet), and using the tokens (roughly a word, sometime part of a word and sometimes a phrase) in the query, identifies other uses of that set of tokens and comes up with a probability of options for the next token.  Then chooses the next token randomly based on the calculated probabilities. Then, including the token the Gen AI just added, repeats the same and get the next token. And repeats.  The randomness is what gives Gen AI its creativity instead of just being a search engine. But it also leads to mistakes, as the Gen AI does not actually understand any of its source texts, so it does not recognize the context of its sources or the fact that some sources may not actually go with others.

This gets more problamatic in a subject like core.logic, where the majority of the texts on the internet are out of date, in a breaking way. Normally I say that Gen AI is particularly good at computing related topics, but that is because of the vast quantity of material available on various message boards programmers and computing professionals frequent to ask questions and get them answered.  Clojure core.logic is very different, as there is not much material (Clojure is not one of the more common languages, and logic programming is also a small niche), and there are at least three different eras, which are not mutually compatable.  And since modern examples do not overwhelm historical ones in quantity, things get mixed together. 

Now, how big of a problem is this.  In my experiences using Generative AI to aid in programming (again, I am a data scientist, so I am interested in data type issues), Generative AI is good for giving programming structure and style (which is very useful, (re-)learning new APIs is time consuming), but it regularly gets logic and the model wrong. But as a scientist, logic and the model are things I am good at, so I don't mind examining code to correct the logic and model, I wanted the help in getting the thing into a running state!  This is why despite Microsoft reporting 40% error rates in Copilot generated code and OpenAI reporting 70% failure in software engineering project when using Gen AI, professional programmers still find Generative AI to be very useful.  It does get things like how to work with an API right, and has pretty good programming style (with appropriate commenting!)  But logic, which the Gen AI gets wrong, is something that any competent programmer does not mind doing themselves.

The key for using Generative AI is the same as other things. It is good for style and structure. Not so good for facts and logic. But that is what subject matter experts are good at. (and most subject matter experts are not so good at style and structure)  So a trained SME can play to a Gen AI strengths and deal with the weaknesses. But only if the human is paying attention to this. 

Next steps, repeating the Adventure in Prolog exercise, but using the Kanren library in Python,


Monday, April 14, 2025

(DRAFT) What do university departments provide to the employers of their students (data science)

 I gave a talk at the 2025 INFORMS (Institute for Operations Research and the Management Sciences) Analytics+ conference (i.e., industry practice focused as opposed to research focused) on Where Should the Analysts Live: Organizing Analytics within the Enterprise. The talk was a result of many organizations asking if analytics should be managed within companies centralized or de-centralized.  One of the topics that came up is the fact that much of the practice of data science is learned on the job.  For some people, they may ask if this is the job of universities. I would argue that the practice of data science is so large that this is an impossible ask. I do so from the perspective of someone who for a while was an industry focused professor within an R1 engineering department.

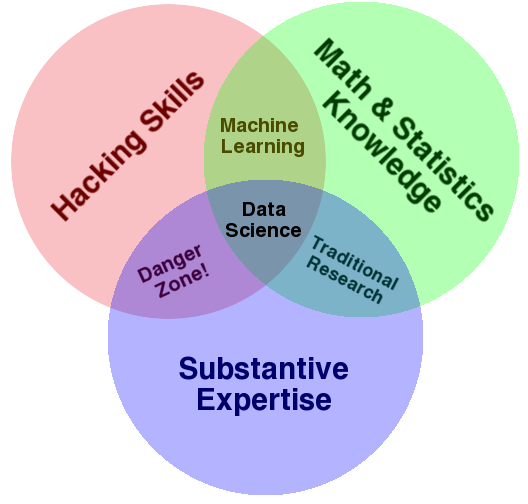
First, what is data science?  Drew Conway still gives the best definition that I have seen in the data science Venn Diagram


Math/stats are the full range of analytical methods as well as the scientific method (the 'science' of data science).  Hacking skills are the computer programming, software engineering, and data engineering specific to working with data (as opposed to what is generally emphasized by academic computer science). Substantive expertise is the subject domain of the work, but it also includes the specifics of the company such as understanding its markets, its customers, and its strategy.

Math/stats is in principle the domain of our university departments.  But university departments are specialists (and research faculty are hyper specialists.  There are two problems with expecting university departments to cover the full range of math/stats that may be needed at a particular company.  First, university departments focus on a particular domain, so it is not expected that they cover other areas of data analysis that a company may need based on their particular interests. Second, they have limited time and unless you are at a very large state university with a particular mission to cover the full range of a subject area, the faculty of a small or medium size department cannot cover the full range of topics that are associated with a given field of knowledge.  So departments create undergrad or graduate programs to cover a foundation, then allow students to specialize (in areas that the department can cover with the faculty they have).  As a non-tenure stream professor, I would explain to students that departments hire to cover a wide range of their field, so they generally do not have much duplication. But each department has to make a conscious choice for what they cover and not cover every time they make a hiring decision.

So what is a university promising with their graduates?  The base set of knowledge and methods (and methods are more important than knowledge, because it is easy to refresh knowledge, you actually need practice with methods), for STEM (and social sciences) the scientific method that creates understanding through iterative experimentation and statistical analysis of experimental results. And most crucially, the capability of learning a technical area. This ability to learn is arguably the most important part of this whole exercise.  Because the world is a big place, and a 17 year old high school student will not be able to predict what the next 40 years will be like. So where a 22 year old college graduate is capable of will be nothing like what she will do over the course of a career. It is hard to develop this ability without college. High school tends to be focused on what you know.  And it is too easy in most jobs to just do what you are doing now, unless you already have the experiences of having to learn new/different domains.  For example, in most STEM and the social sciences, statistics is a side knowledge domain. But for those who go into data science, the fact that they learned statistics makes learning applied machine learning easy.  And the scientific method, while it may not be the thing you think about when you think about engineering or economics, is ingrained into the methods by which they see the world.  It is relatively easy to teach skills, it is much hard to teach mindset or the ability to learn new ways to think.

Is there anything different about artificial intelligence? Actually, yes, which makes it easy to learn for STEM and social science trained people, but also dangerous.  By definition (see  Section 238(g) of the National Defense Authorization Act of 2019) any version artificial intelligence are those which perform tasks without significant human oversight, or that can learn from experience and improve performance when exposed to data sets. In particular, it means that the creators of an artificial intelligence system or model do not have to know how the system that the AI is being added to works. For those in the mathematical sciences (e.g. mathematics, statistics, applied math, operations research, computer science), this is incomprehensible. Even the most theoretical researcher has a core belief that any application of mathematical models involves representing important aspects of the system in mathematical form.  But this makes AI (such as machine learning) relatively easy to use in practice, and this has a low barrier to entry.  But if someone, like a company, actually has subject matter expertise relevent to the problem at hand, not incorporating that expertise into the model is lost value.

Is it enough to be able to learn new skills as needed?  No, we also have to be able to learn to think differently.  The most prominent example is Generative AI. For those who only have knowledge and skills, Generative AI is a completely new thing.  For those who are able to come up with new ways of thinking, Generative AI a combination and extention of deep neural nets, natural language processing, and reinforcement learning trained on the published internet.  And its strengths and weaknesses are not random facts akin to gotchas, but are based on characteristics related to its origins. And knowing that makes a world with Generative AI different, but something that we can use.   This past week I went to a seminar on quantum computing. The mathmatics are completely beyond me. but I could understand enough to recognize the reason for its promise, what is lacking, and some sense of what are some key intermediate steps that have to happen if it ever reaches the promise that many talk about.  And this practice of being faced with completely new subject domains is something I do frequently.

So what can companies expect from the graduates that come from their university partners (whether through former relationships or merely through hiring in the community).  Sometimes it is a collection of specific skills. But more important, a college graduate comes with a testiment that person is able to learn a range of skills and knowledge that are part of a cohesive whole and put them to use. And having done so once, will be able to do it again over a 40 year career.

Wednesday, April 17, 2024

On simplicity in data science communications

Everything should be made as simple as possible, but no simpler  paraphrase of A. Einstein

 I spent this past week at the 2024 INFORMS Analytics conference.  One of the major themes across both the speakers, the panels (of which I was a panelist), and conversations in the halls was soft skills for data analysts/Data Scientist.  Data scientists are subject to the same stereotype that is used with all those who are technical specialists, that they lack soft skills and this prevents our end stakeholders from understanding and being able to take advantage of the knowledge and capability we bring to our organizations.  And that the most commonly provided solution is to ask the specialists to simplify the delivery.  But, other than an excuse for those with business backgrounds to beat up on the geeks, I don't know if this is the right solution. A better direction would be, as John-Eric Bonilla described it, the data scientist acts as a translator, the person who takes the aggregated insight of the data and of the subject matter experts throughout the organization and translate that into the framework of the decision maker.  This is a tall order, but this is the reason that Drew Conway in his Data Science Venn Diagram gives subject matter expertise equal weight with the math/stats and the computer skills that get so much prominence in these discussions.

When I was deployed in Afghanistan, a brief that I prepared was being pushed up to the Commanding General, ISAF- Afghanistan. Members of the General's staff was present at the last brief, and their comment was that it was a good brief, but I needed to redo it in their format. And they gave me a highly specified template. Now, I could be judgmental and say that it met no conceivable definition of "simple", but I won't. Because I realized immediately that the template had two functions.  First, to shortstop any Powerpoint Rangers and save the General from Death by Powerpoint, because a commanding General in a combat zone is a busy person and does not have time for that.  But also because the purpose of the template was to present the information inside the framework that that particular General processes information for the purpose of making a decision.  And that specificity of presentation, that the recipient can process the information using the framework they have as an expert in their area and make a decision, is the goal of technical communications, such as data science.

The common recommendation to data scientists is that we need to simplify our work for presentation to our decision maker audience.  And the reason that we are given this message is that our decision maker audiences do not need or want our technical explanations and they cannot understand complex topics.  But this view of our decision maker stakeholders is demeaning.  So far, in my career I have found the decision makers that motivate my work to be intelligent, subject experts in their own right, and fully capable of understanding detail and nuance.  But the key is not to remove subtlety and detail (which is the reason this person is in the position of decision maker), but to present the subtlety and detail that is important.  Certainly, the tendency of technical experts to want to focus on the story of their work does not help either. The answer (IMHO) lies in the use of frameworks.  Every specialty community that I know of has frameworks that are used to organize and communicate information. Examples are the range of SITREP formats used by specific emergency response and military communities, the 9-line medevac report, frameworks used for reporting patient condition in specific circumstances in the medical community.  And individual leaders have developed a framework to make the decisions, even if this framework is masked in intuition. And in the ideal case, that record of good decisions is the reason they are in their position.

That makes the key of data communication is to understand the decision making framework used by experts in this situation. In the case of the then Commanding General - ISAF, this framework was formalized by the General's staff, so that all briefs going to him were presented in that framework. And the General can fit all of the provided information into his internal decision making framework.

When this framework has not been formalized, the key is direct communication between the data analyst and the decision maker (or surrogate). The data scientist needs to communicate with the decision maker, or someone who knows how the decision maker things (either intuitively, or because they are members of the same professional community who analyzes information in a standard way) to understand how the decision maker thinks.  Then, this identifies both the type of information and the criteria that will be used to make the decisions.  The data scientist task becomes either identifying the data needed to provide this information, or to use the data that is available to come as close as possible to the information required.  And this unlocks the value of the data scientist, without diminishing either the role or capability of the decision maker.

There are a few ways for this to fail.  First is from the data scientist side. Many technical experts have no desire to learn the decision maker process. This is often accompanied by beliefs that the technical facts make the needed action self evident. Then from the other side, there are those who think that they give commands to people and the people doing the work should be able to get it done without needed resources. Both fall under the heading of lack of communications between the analyst and the customer, which is universally known to be the most common cause of data project failure.  The role of the data analytics manager is to ensure that constant communications is maintained and to intervene if not. (There are managers who think their role is to be a broker. But this also breaks communications and does not help change the most common cause of failure in data analytics projects)

Is being a translator easy? No.  But I have found on my projects is that the data scientist is often the first person who realizes all of the people who are actually involved in an activity, because the data scientist is tracing all of the data elements. So the data scientist needs to learn everyone's language to get a good picture on what is actually happening, and communicate to the decision maker in a format the decision maker can understand. Yes, this is hard (80% of data projects fail, and while vendors use this to market products, those who investigate that number say it is mostly communications). But we are not the only people who have to take complex information and transmit it to a decision maker in a form they can understand and use to make decisions.  The UX community does this too.  And, often they do it well.  So can we.

Thursday, December 31, 2020

Book review: Weapons of Math Destruction: How Big Data Increases Inequality and Threatens Democracy by Cathy O'Neil

Weapons of Math Destruction: How Big Data Increases Inequality and Threatens DemocracyWeapons of Math Destruction: How Big Data Increases Inequality and Threatens Democracy by Cathy O'Neil
My rating: 5 of 5 stars

There is a popular diagram that describes data science as a combination of math and statistics, computer programming skills, and subject domain expertise; and describes the dangers of what happens when one of those three are not available. But among academics, there is an opposed line of thought that says that math and statistics methods are pure and subject independent. This book is firmly against the idea that algorithms are a defense against bias. The reason may be that while the mathematician/machine learning modeler may be naive, the setting of the implementation is not, and the questions that are being asked as well as the data being used to train models are both affirmative choices where the analyst and customer have agency. And pretending to be a naive analyst leads to errors in the result that have real consequences.

O'Neil goes through a number of cases. But while many accounts will go into the "evils" of big data and machine learning, she does suggest good practices that can prevent the dangers. First evaluation of the model. The model should be tested by actually looking at its predictions and seeing if they are true. In statistics this is done through control groups. In data science this is done through holdout test sets. And in her case studies, she points out this is not done. Next, compare the model input data set to the population that will be applied. Again, she regularly points out where this is not done. A third one is the well known make sure that you are not using machine learning to perpetuate an undesirable status quo. (but this argument is too easy)

Read this at a book club at work. It spurred a great discussion, that has carried over into other conversations. Definitely recommended to those involved in data science/analytics where people are impacted, and in areas where data analysis is becoming a bigger part of life, so as someone who works with the results of analysis you can ask good question, both while the analysis is planned and performed, and in understanding and questioning the results.

View all my reviews

Tuesday, July 28, 2015

Lessons in teaching: teaching exploratory data analysis with R

Last spring, I took over a course labeled as information systems engineering.  This is aimed at sophomores in engineering.  Historically, this course focused on using the MS Access database.  I was asked by the department to take this over after several years of commenting that our engineering seniors have inadequate computer programming skills, as evidenced by the amount of effort they spend on their senior projects doing tasks that would have been much simpler if they tried programming.  Last year some of the faculty tried experiments in their classes where they had students code in an assignment (generally they asked for C). In every case this went very badly.  So they asked me to take this course and change it so that it covered programming and specifically to use R. (I am effectively the primary data analysis faculty here).  In keeping with the course title, I chose to focus the course on data analysis, with one month focusing on databases and how to think about data problems (and giving them time to gradually learn R), the rest on exploratory data analysis.  I used as the primary text Data Manipulation with R by Phil Spector, and as supplements GGplot2 by Hadley Whickam and An Introduction to Data Cleaning by Edwin de Jonge and Mark Van Der Roo. I presented the CONVO framework for thinking about data problems based on Thinking about Data by Max Shrum.

As freshmen, they would have has CS0 (the Association for Computing Machinery designation of introduction to computer science for non-computer science/electrical engineering majors) material covered over a two course sequence that also covers mathematics for engineering (primarily linear algebra).  The language of instruction is primarily Matlab, but they also cover C and, depending on instructor, Python (there is one module that is sometimes covered by Physics faculty, and they like to use Python).  For databases, there is another course on databases taught by an adjunct faculty who used to teach databases for information systems.

For tools I used SQLite (more on why this and not MS Access later), SQLite Manager, R, and R Studio. Prior to the end of the previous semester I sent everyone an email with links to videos introducing them to R and R Studio and encouraged them to introduce them to R through typing out a tutorial (I explained that they would actually learn R over the semester, the typing exercise was to ensure they had seen everything once before we actually needed it in class.).

For assessments, there were weekly labs for computer knowledge, exams mostly covered how to think through data problems. A semester project with two milestones (plus completed project) was the main way to assess how well they developed computer programming competency.  Each week, we covered one

We had three datasets that I used as teaching and lab examples throughout the course.

  1. Titanic survivors
  2. National Survey of Family Growth
  3. American Community Survey (U.S. Census, Pittsburgh North PUMA)


Some observations and notes

1.  SQLite vs MS Access.  I was surprised to find out that MS Access has a relatively low size limit on databases. It was not able to handle either the National Survey of Family Growth (expected) nor could it handle a single PUMA for the American Community Survey (this was a surprise).  That meant we had to use SQLite for the entire course. (my Mac students were happy since this put them on equal footing with the PC students). Next time I will just use SQLite. (and use MS Access only to explain why we are not using MS Access)

2.  Learning R.  In a pre-class survey, the entire class indicated complete lack of confidence in programming to fulfil a task (expected).  I think that the standard programming language belief that it is always easier to learn a second programming language failed in this case, because I did not realize just how bad their first experience was.  While the first month was very intentionally a confidence building exercise, I think that for a portion of the class, they really needed to start from scratch.  Next time around, I will spend an entire period doing nothing but walking the class through R.

3.  Data manipulation.  This included covering data structures (text, dates, dataframes), regular expressions, plyr, reshape, and missing values imputation.  Essentially the Hadleyverse v. 1.  One issue here was the wide variety of potential topics. While I think every topic got used by someone in their semester project, some of the student evaluations complained about my teaching topics that were not on the exam.  Essentially, for people who are only used to computing on numbers, the entire topic of data manipulation seems to be a heavy cognitive load.

4.  Visualization.  I taught qplot, but I think that I should have gone straight to ggplot.  I think that either I go the traditional route and build every type of plot as an individual entity, or I present the grammar of graphics approach and build plots. Either way, now that I've taught it, I don't think qplot helps in either, and it is a lot less capable. (every groups final project pretty much had to transition to ggplot)

5.  Projects. I let  the students find their own datasets and questions, subject to the fact that they had to write the project purpose using the guidelines we covered in thinking about data.  The big division in quality of the projects was the richness of the dataset.  Next time, I will be a lot more strict on the dataset, in particular, I had a subjective guideline that they should not consider it practical to look at the whole dataset. In some cases, this still was a very small volume, and it made for a trivial and uninteresting report.

6.  Thinking about data. I used Max Strum Thinking about data framework where for a data project, one should identify the COntext, Need, Vision, Outcome.  Every week we read a contemporary news article that included a data component (mostly from the fivethirtyeight.com website)  Each discussion opened up with class discussion to summarize the article into this CONVO framework, then a discussion of the analysis in the article itself.  This actually worked out pretty well.  Each exam had at least one CONVO focused question, and generally they did well (and of the people who did not, there were no surprises based on class participation)

7.  News articles.  I had a wide range of news articles that we covered in a weekly discussion, drawn mostly from fivethirtyeight.com, the Upshot column from the New York Times, and the data series from the Washington Post.  Each article was assigned at the end of the week, for discussion in the Tuesday morning lecture.  Discussion opened up with a summary based on the CONVO framework, then we evaluated the data analysis presented in the article, followed by how we could change it to make it better or to answer a different question.  These class periods were fun. My goal was to take 15 minutes for each article, in a few cases we were on a roll so we let it go to 30 minutes.  I had good participation.  And it showed in the CONVO question on exams, and generally people did well when I asked them to imagine a data analysis based on data presented on a test (this was the last part of a multi part question, where the other parts were about the data presented). One disappointing thing was that when it came time for course evaluations, I was rated poorly with how the class material relates to the everyday world (like all engineering courses do). So I have to figure this one out.

8.  Course evaluations. When course evaluations came in, they were roughly a uniform distribution, which makes them very hard to interpret. In addition, comments that expressed weaknesses were mirrored in the comments that expressed strengths. So that meant that I had terrible averages and a chat with my department chair.  Fortunately for me, the generally accepted belief is that the broad diversity in the teaching evaluation is due to pushing the students harder (i.e. making them do programming again) and that this is part of improving the department as a whole. Hopefully when he meets the dean to review the faculty the dean agrees with this assessment as well.

9.  Class projects.  About a quarter of the projects (teams of1, 2, or 3) were genuinely impressive. Many projects with 100,000s of records, a few with millions of records, several dimensions, and data analysis that used layered visualizations to explore.  Most projects were a little more modest, thousands of data points and reasonable visualizations. Some projects were personal in nature (looking at issues in their home towns), others were fun (several projects revolved around music or sports) A number showed evidence of lack of confidence, shown in very unambitious data sets.  The issue with this group is how hard to push. One of the known problems with CS0 or CS1 is that they complete destroy people's confidence in programming, and a substantial portion of those who take one of their courses completely leave the field, or in the case of engineers, avoid programming at all costs in the future.

Next time around:

1.  Using a framework like CONVO (Max Strum) works. I am pretty sure everyone at least learned how to think about problems and settings.
2.  Skip MS Access.  I think I probably spent too much time on databases and working with the MS Access interface.  Next time, going straight to SQL is probably enough, given that the limits on MS Access means that we cannot do interesting datasets.
3.  I liked using three datasets the entire course.  Actually, some of them used the American Community Survey for their semester projects (after reading in multiple PUMA, e.g. an entire metropolitan area instead of only one PUMA).
4.  One question that I will have to think about is how much of a do-over of CS0 this course will be.  Clearly, as it is most of the class seems to get it the second time around and a good portion are pretty impressive. But there is a pretty large fraction that finished CS0 absolutely convinced that programming is forever beyond them.

Thursday, July 09, 2015

Data Manipulation with R by Spector: Book Review

Data Manipulation with RData Manipulation with R by Phil Spector
My rating: 4 of 5 stars

The quality that programming language based data analysis environments have that menu driven or batch environments do not is the ability to manipulate data. That means transforming data into usable forms, but it also means cleaning data, manipulating text, transforming data formats, and extracting data from free text. While R falls into this category of data analysis environment, almost all of the available material focuses on the application of statistical methods in R. This fills a much needed niche in how to process data. I still do not regard R as my goto tool for data manipulation, but this book means I am more likely to stay in R than otherwise. I used this as a textbook in a lower division data analysis course and the class went from a group that only half remembers Matlab to being able to process and analyze fairly large datasets. A comment I received was "I looked back on the work done in this project and I cannot believe I actually did that!"

The first part of the book is reading in data and writing out results. It discusses both text (csv, delimited, fixed) and working with relational database. One note is that the database they use is MySQL. This was easily convertible to SQLite, which is what I used in my class because my students are not IT savvy. I also used supplementary material for SQL (which is readily available) Then putting things together into data frames.

Next are a series of data types: datetimes, factors, numbers. For people who have only worked in Excel, these are deal breakers. Even using Excel, these are areas that often go unnoticed by students and lead to problems.

Character manipulation is about working with strings and a gentle introduction to regular expressions. For many of my students, they have never manipulated text programmaticly before, so this chapter was quite successful. For Regular expressions, well it provided a taste of it, enough to solve the lab assignment. I supplemented it with other material, but noone was going to learn regular expressions in 5 pages.

The best part of the book was the sections on aggregating and reshaping data. This is what made what my students were doing with R start to look like magic. Aggregations using the apply family of functions, reshape to convert data into long or wide formats, combining data frames, and an introduction to vectorization. This is not going to make anyone a functional programmer, but these are key idioms and Spector spent a lot of time here.

I am not going to prefer R over Python for working with text and manipulating data, but Data Manipulation with R shows how to do some non-obvious things. The examples are all interesting enough to be useful, and they all work as is. And this goes deep enough into some pretty powerful capabilities that expanded my students understanding of what is possible. While it is becoming dated (an update would have to include dplyr), the approaches it provides put the reader well on their way to being an accomplished R programmer, not just someone who feeds data into functions.

View all my reviews

Thursday, June 18, 2015

Applied Predictive Modeling By Kuhn and Johnson: Book Review

Applied Predictive ModelingApplied Predictive Modeling by Max Kuhn
My rating: 5 of 5 stars

I regard this as a more applied counterpart to more methodology oriented resources like Elements of Statistical Learning. So it applies machine learning methods that are found in readily available R libraries. In addition, the author is also the lead on the caret package in R, which provides a consistent interface between a large number of the common machine learning packages.

1. Built around case studies that are woven through the text. For each chapter, the math/stats is developed first, then the computational example is at the end, so that the example can develop data manipulation, application of method, then model evaluation. I like this as it allows for more complex and messy data sets than when using a new, small example for each problem. Also allows for better discussions when illustrating the differences between methods.
2. Data manipulation/data processing is given a separate chapter early on. I appreciate the attention given to working with the data (e.g. missing value imputation). There are other resources in data handling, but not in the same place as those that address the statistics methodology.
3. Emphasis on model evaluation. There is an early chapter devoted to model evaluation. Then each major section of the book has an early chapter devoted to model evaluation of that class of problem. This is in contrast to many books that are built around types of algorithms, and model evaluation is fit in. Methods and algorithms are relatively easy compared to the thought process of determining what is the right thing to do. It figures that this book will be strong in model evaluation when one of the authors is the lead on the caret package in R.

I used this as a supplement in teaching a data science course that I use a range of different resources because I need to cover working with data, model evaluation, and machine learning methods. The next time I teach this course, I will use only this book because it covers all of these aspects of the field.

View all my reviews

Thursday, December 18, 2014

Thinking with Data by Max Shron: Book Review

Thinking with DataThinking with Data by Max Shron
My rating: 4 of 5 stars

Thinking with data focuses, not on how to do data analysis, but on the questions that one should be asking. It does so in two ways, first through providing an overall framework to looking at situations, then working through a series of topics using examples to serve as plausible paths of decision making. In a fairly short book, it covers the framework, determining purpose, threats to validity, experimental design, and a few extended examples that illustrates both concepts and deviations. It is a useful quick big picture book that is useful for those whose focus has been on the methods of data analysis or for those who do not have a quantitative background but are faced with data questions and need to be able to work with data analysts.

The first part is probably the most rewarding. Max gives a framework of how to frame a data problem. Context (who is interested in the problem, what are their overall goals and why, what is the goal of the project), Need (the specific need that could be solved through the use of the data model), Vision (an understanding of what the results of data analysis would be like), and Outcome (an understanding of how the data analysis results would be used). The end of this framework would be a story that you can tell

Next is a discussion of how the details of the problem could be fleshed out. The content is probably familiar to anyone who has had to work with stakeholders. The valuable portion here are the vignettes of working through this process on projects. In particular the fact that the vignettes are not projects that necessarily go smoothly, so it does not have the idealized feel that many published vignettes do.

Next is a discussion of presenting the results. The focus here is that the results are not the output of the data analysis, but the use of the data analytics methods to construct and argument. And that argument is going to be presented to people who have backgrounds, prior beliefs, prejudices, and sometimes reasons to argue against your findings.

How to address these disputes is through conducting experiments and testing alternative hypothesis. So a section of the book is on defining causality and designing experiments (interventions) to handle different types of alternative hypotheses.

What makes this useful is the framework and the vignettes. It is good for a quick introduction to this area. As others have noted, it is not tightly organized, so after the first chapter with the framework, it is not useful as a reference, but it helps in focusing how to think.

I teach classes on working with data, and one area that is difficult to get across is the concept that there is a unified whole in the topic, not only a bunch of separated techniques. I plan on using much of what is in this book to help provide that unified whole my classes.

Disclaimer: I received a free electronic version of this book as part of the OReilly Bloggers program.

View all my reviews

Friday, August 29, 2014

Clojure for Machine Learning by Wali: Book review

Clojure for Machine LearningClojure for Machine Learning by Akhil Wali
My rating: 3 of 5 stars

For a book that is about [programming language] for [computational task], there are two approaches. One is to assume basic competence in the language and teach the task, the other is to assume that the reader has basic competence in the task and teach how to do it in a language. This book assumes knowledge of Clojure and tries to teach machine learning. But I find that it does just enough to be dangerous. It has a series of methods but does not provide discussion on why you would choose once class of method over another, and it completely skips model evaluation. What this creates is someone who has a good idea of the mathematics and implementation of methods, but not when to use it or if it actually did what was intended.

This makes me slightly different than the ideal audience of this book. I am learning Clojure and have only started using it for data analysis in real life. However, I have used Python and R for data analysis for several years now, and I have use both of them (and trained students to help me using both) for different machine learning projects (and I use R for teaching a course in data science).

Each chapter in Clojure for Machine Learning takes a look of a class of machine learning algorithms and takes several looks at it. Generally, Wali looks at the mathematics and theory of the algorithm, then a simple implementation in Clojure, then some examples of using existing library implementations on a problem. The mathematical treatment seems nice, but it would not compare to an actual text on machine learning/data mining. And while seeing an implementation in Clojure has some value, I would have liked to have seen more humility in doing so (i.e. some recognition that there are limitations of an implementation that can actually fit into a book of this size with everything else that needs to be done).

Two things that bother me about this after I finished was realizing that for each class of algorithms, the book only covers one or two methods. Which is fine, but it does not even acknowledge that there is a greater world. And as there is no discussion on how to perform model evaluation, an enthusiastic reader may reach the conclusion that they know what they are doing when implementing them against a data set and problem. Essentially, the enthusiastic reader knows enough to be dangerous and does not know what he does not know. If I were to suggest this book to someone, it would have to go with a severe caveat that what you know after this is how to set up a machine learning problem. More research has to be done to determine what actually needs to be done (the libraries used are much broader than what is covered) and then, learn from somewhere else how to evaluate or tune the methods used.

In the end, I would treat this as a book of examples or cases of Clojure being used in machine learning. There is room in the world for a book on Clojure for machine learning, but this is not it.


View all my reviews

Tuesday, August 19, 2014

Clojure Data Analysis Cookbook by Eric Rochester

Clojure Data Analysis CookbookClojure Data Analysis Cookbook by Eric Rochester
My rating: 5 of 5 stars

This book is a good tutorial on data science using Clojure. It starts with working with data (access and cleaning up), then the various chapters cover a range of tasks from focusing on numeric computing (performance, parallel processing), statistics (Incanter and other numerical libraries), working with other numerical software (Mathematica and R), graphics, and the web. The topics are actually a fairly complete look at data science, so it feels more like a tutorial than a cookbook.

I found this to be a great text on working with data in Clojure. My background is in technical computing, mostly R and Python although I also use C, Java, and Fortran as needed. I've been dabbling in Clojure, but I had not made the jump from doing tutorials and exercises in Clojure to doing something for real. Working through this book has improved my skills in setting Clojure up and using it for real tasks. The book code also provides a nice example of good programming style (I think) that I can see myself trying to emulate.

A book on data science is necessarily about the practical details of implementation, not about mathematical and statistical methods. Presumably, the reader has another source about the details of various statistical and machine learning methods that they can use to figure out what to do, then the Clojure and Incanter API documents tell you how to do it, and this book is about how to do the 80% of data science that is not about implementing the algorithm, but about how to manage the data, then work to communicate the results of the algorithm in understandable ways. This book is probably what brings me from dabbling in Clojure to being able to use Clojure for real tasks. Well done.

View all my reviews

Friday, May 16, 2014

Notes from teaching data science for the first time

Drew Conway Data Science Venn Diagam
I spent this past semester teaching a course in data science. While there has been a data mining course taught in the department, it is offered irregularly and had a different focus.  The premise for the course I taught was that data science was the intersection of data hacking, mathematical and statistical methods, and domain knowledge (with props to Drew Conway). The students I had generally had little to no programming experience (or meaningless background). All have had a first course in statistics.

I used two texts. First was Stanton Introduction to Data Science, which is used in the Syracuse Data Science certificate program.  Second was Introduction to Data Mining with R by Luis Turgo.  All of the students were also told to go through Introduction to R prior to the beginning of the course (or as early as possible).

The class started off going through Introduction to Data Science, which included a few introductory chapters to data analysis, and introduction to R and the R Studio IDE.  Then were chapters on some basic methods at the basic level such as text processing, review of regression.  Then additional methods such as association rules and support vector machines.  We then switched to Data Mining with R which were a series of case studies.  Each case study had some form of data munging (manipulation) required, with the first one having an involved demonstration of how to handle missing values, either determining the correct value or removing as appropriate.  Each case also had a lengthy discussion of the methodologies used, with what each is being used for and a basic understanding of how it worked and its implementation using libraries in use with R (there is a book package, but it has mostly data sets and some functions to assist in data manipulation and visualization.

The assignments were built around individual projects. Their were three presentations, exploratory data analysis, preliminary data analysis, then final. The first two they could work together, but the final one had to be solo as they needed to have individual topics (even if they used the same data sets). The intent was that these assignments would build towards a final goal (but they had flexibility to bail if they wanted to mid-semester.

Probably 1/4 of the students found projects off of Kaggle, which is useful because it has a nice complex data set and comes with a legitimate question.  Another 1/4 of the students used public health as a motivating area (University of Pittsburgh is home to Project Tycho, which is a rich dataset of infectious disease in the U.S., also, there is a joint program with the Department of Industrial Engineering and the School of Public Health).

Some problems that came up. First, I discovered that many of the students had an operating assumption that all data was normally distributed, and they constantly made claims that their data was normal. Even when the data was noticeably skewed.  This was embarrassing when they would make statistical tests, and the test graphic would include the corresponding normal approximation which was nowhere near the data. I eventually figured out that for many of them, when they took statistics they were constantly fitting normal distributions in their homework data sets, so I explained that their textbook problems were written so that their would be a normal distribution to find.

Another problem was the lack of a hypothesis.  Many students started to pick problems that could be solved through linear regression and declared that because it met a p-value criteria they were done. (and in some cases, I recognized the data set as being a teaching data set). But even though they could fit a regression, there was no theory on why the data related in a given way. Essentially, they were pushing data through an algorithm without any subject understanding.  Most (not all) of them got the ideas by the end of the second presentation.

A third difficulty was skipping the model evaluation.  Most of the methods covered have some parameter that was the analysts choice, so they should have explained how they chose the value of that parameter.  Generally, this should have been a discussion of making the tradeoff between closely approximating the observed data and overfitting.  Some students skipped this completely (essentially, this is what would happen if you fed data to an algorithm then reported the result using all default values)

One big observation I had by the first presentation was being able to identify the level of programming ability by the choice of projects.  I strongly suspect that a number of students were minimizing the programming required.  But that became reflected in the level of ambition of the projects.  Non-programmers tended to choose simplistic data sets with little variety.  I think the difference is the workload.  People who could program were able to slice the data available on a multitude of dimensions without regard to scale, since the computer would do all the repetitious work, while those who could not program generally were reluctant to have large sample populations or multiple data sets on the same population.

Things for next time.  First, impress on them the need to learn to program.  Essentially, the projects from those who could program were so much richer than those who could not (even at a low level of programming skill) that I was embarrassed for those who could not program.  Second, I should push harder on the need to have a hypothesis that was driven by domain understanding of the problem. This should be pushed harder from the very beginning to discourage people from merely pushing data through statistical methods and reporting results.

For teaching data mining, I think that the organization of the course needs more methods focus. The principle text was case driven, but that meant that methods were being introduced in a fairly arbitrary sequence.  I ended up doing a methodology focused review over the last few weeks. What I should do next times is after the introductory section (Stanton Introduction to Data Science), have the next several lectures be a tour of the classes of data mining methods (regression, classification, clustering, feature selection), then do the case studies.  One resource I found useful in this are articles from the Journal of Statistical Software, many of which are focused on R packages that implement classes of methods.

This was a very good course. I wished that the students did more participation (by the final presentation, there were some points that were given based on shear quantity of comments, which several students took advantage of). Some of the projects were much more ambitious than any other done in the MS program. And I have a lot stronger argument about the need for the graduate students to know scientific programming as a skill set.

Sunday, May 11, 2014

Data Mining with R by Luis Togo: Book review

Data Mining With R: Learning By Case StudiesData Mining With R: Learning By Case Studies by Luís Torgo
My rating: 3 of 5 stars

Data Mining With R (DMwR) promotes itself as a book hat introduces readers to R as a tool for data mining. It teaches this through a set of five case studies, where each starts with data munging/manipulation, then introduces several data mining methods to apply to the problem, and a section on model evaluation and selection. It fills a place in the literature since it devotes a lot of space for data manipulation before applying the various methods and model evaluation afterwards. But it is hard for people learning data mining since it spreads the types of model throughout the book.

I used this as one of two texts to teach data science to people whose programming and data analysis skills were generally at a very low level. The big advantage of using a programming environment such as R for data mining is the fact that you can do data manipulation in the language, then apply the methods. Many of my students have taken machine learning elsewhere, but they always used prepared data sets, so this emphasis on data manipulation with several very disparate data sets is a unique feature.

The second big advantage of this book is the focus on model selection. For each chapter, the book goes through the exercise of determining which model should be used, and how to diagnose the model to determine which one is appropriate and best for the problem. I especially appreciate the fact that in some cases, the conclusion of the book after model evaluation is that the method did not work for the problem and question at hand. Because most textbooks focus on demonstrating that you did find something, in some cases my students get confused when in real problems they did not find an effect.

Where the book is lacking is the fact that the methods are scattered across the case studies with minimal organization. While this is a result of the realities of the cases, the book would have benefited from a roadmap chapter or introduction that gave methodological context (i.e. what methodologies are used in the book and where they are). This lack made it very difficult to use as a textbook, and by the time I was done using it I was essentially building the roadmap to use the book. This makes it not useful as a standalone textbook for such a course, but very good if there is another text that gives the overview of the methodologies.

View all my reviews