Showing posts with label teaching. Show all posts

Saturday, June 06, 2020

Teaching kids micro:bit and makecode during COVID-19 quarantine

A couple of weeks into social distancing, as the kids various activities had shut down with no plan on how to open, we were faced with the question of how to keep our kids occupied.  We have generally followed the principle of having one artistic, one physical, and one STEM activity ongoing per child (plus chinese), and for the older one we were trying to fill in the space opened as his robotics (First LEGO League) activity had closed down.  And we wanted to have it be somewhat social, as we also wanted him to maintain his connections, as well as make sure there was a community of friends and relationships that may endure.

For classmates, our first community that we reached out to were the other kids from his LEGO robotics group.  I already had a number of email addresses from organizing an outing, and these were all kids who knew blockly style programming (or Scratch like) and programming in the physical world.  The next source was a local chinese parent WeChat group.  And we were looking for kids roughly the same age as DS9.  And we found one more from a camp that DS9 was in last year.

The goal was teaching programming, and for this, I choose block style programming, specifically on the BBC Micro:bit.  The micro:bit was created for teaching introduction to computer science in Britain.  They goal was a microprocessor that had on-board physical inputs and outputs, the ability to connect to other components, and could by taught by middle school teachers, who had a wide range of comfort level in teaching technology, and likely no comfort in teaching programming. Blockly style programming (using makecode) is particularly suited as it had enough range to allow the application of computer science basic concepts, but without issues such as syntax, which in normal text based programming often dominate an introductory computer science course.  (in computer science, the concepts are the important part, syntax is merely the implementation.  The focus in time and energy on syntax is considered a distraction)

For materials, my mainstays of Adafruit and SparkFun were both unavailable.  Adafruit was designated an essential business, but was focusing on medical suppliers. SparkFun was closed. So we had to source kits from Amazon.com, who was working from stock.  The micro:bit itself was available, but kits tended to be from one of the multitude of unknown suppliers.

For curriculum, I used the book micro:bit in Wonderland from Tech will save us.  The target audience was people who could not program, and it was craft based, where the projects all had a programming component and a craft component (that interfaced with the micro:bit board through alligator clips and the touch pads. As an added bonus, there was a motivating reading, from Alice in Wonderland (which many people already owned, but was also free as it was in the public domain on Project Gutenberg.)

Some unit notes:

  • Impacts of shutdown. The micro:bit was generally available on Amazon.com, but the kits of basic supplies were not.  There were two sources that were left, the https://www.techwillsaveus.com/site and various no-name kits on Amazon.com  The no-name kits tended to be breadboard based kits as opposed to alligator clip based kits.  For elementary and middle school classes, the alligator based kits would have been much better
  • Block coding on micro:bit was something the kids took to easily. Even the one who had no programming experience (meaning not even having background in Scratch).  Using makecode was easy. By the second week everyone had a microbit (not necessarily a kit) and getting working makecode onto the micro:bit was not hard.
  • First hard lesson was the control of the LED light, which was the first lesson that got off the micro:bit board. As this was really the first experience in physical computing, I believe that this is also considered a first milestone in electrical engineering.  It took a lot of one-on-one attention to get everyone through this.  But all of the other physical computing lessons (touch pads, connecting to sound speaker, other LED light projects) went much easier.
  • If-else was not a problem
  • Kids enjoyed the sound projects. Both the buzzer, then the music box.
  • They also had no problem working through complicated if-else trees 
  • The big assignment here was to use the microbit as a musical instrument, which meant making lots of sounds (kids like noise)

Really, the only difficult week was the first experience with lighting a light bulb.  While many students had experience with LEGO robotics and things like SPHERO, those kits deliberately hide the difficulties in connecting a controller to something off the controller. So after that, it becomes easier.

One thing I would do differently if I had to do this again, I would use the Sparkfun gator:circuit kit.  It breaks out many comment electrical components and packages them along with resistors (needed to make sure that low resistance components like LED lights do not get burnt out) to make a alligator clip friendly board, which is much easier than trying to connect components on a bread board (I think Adafruit has components that do this to, but not packaged in a named kit).  Leave the breadboard work for high school or later.


As this whole teaching kids programming experience was not nearly as traumatic as I thought it could be  :-)   there is going to be a follow-on.  But instead of having the focus be technology and computing, the goal will be to actually use these skills to do something, so we are going to take the Sparkfun gator:science kit, which has electronic sensors that can be used with the microbit to create data collection lab instruments, as the basis for an investigative science course. And in true co-op style, there will be a team of parents who will be trying to teach the kids science.  :-)


Saturday, March 11, 2017

Parenting Month 76: No longer one of the little kids

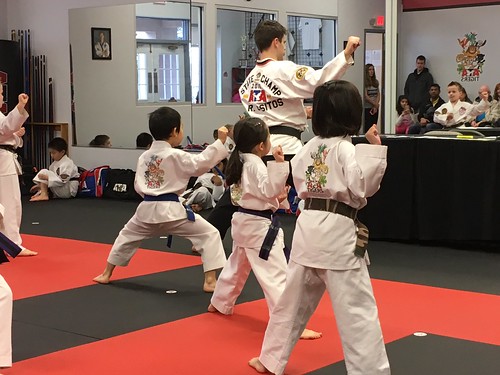
The major milestone of the kids is the 6 year old has had his last American Taekwondo Association (ATA) Tigers belt testing.  In the ATA, the Tigers is the group for 4-6 year olds where they allow for follow the leader in testing and advance at half speed (in each testing, they cover half of the form that the older groups do. Developmentally, this makes a lot of sense, somewhere around 7-8 kids begin to reliably tell left from right and there sense of time and sequencing develops.  However, at this school, they join the older kids (7-12) after the first half of blue belt (i.e. they will test for brown belt with the older kids).  At this testing cycle, he is the only one to advance due to belt promotion (there are two others doing the same, but because they turned 7)


ATA color belt testing
Blue belt testing.

One thing we have appreciated about his taekwondo classes and tournaments is that he has been one of the smallest ones, but has generally been one of the more focused kids, which results in him being noticeably more in line with the class than the others his age. And the way that manifests itself is that the teachers use him to flex pairings during sparring or self-defense testing, he will match his partner. While generally they try to match kids on size and temperament, they can pair him with smaller or shyer kids because he won't bully people over.  And with the bigger kids, he has enough skill that he will not get knocked over or hurt.

But now that he is with the older kids, as the youngest and one of the smallest in the room (there is one smaller). And we actually like it that way. We have always felt that we wanted him to be comparing himself to kids who were older, bigger, and smarter than him, so that there would always be someone ahead of him and he would always know what better looks like.  We have appreciated this in Taekwondo, where the teaching philosophy is that at whatever level a student was, the aim of the day's lesson was to always get better.
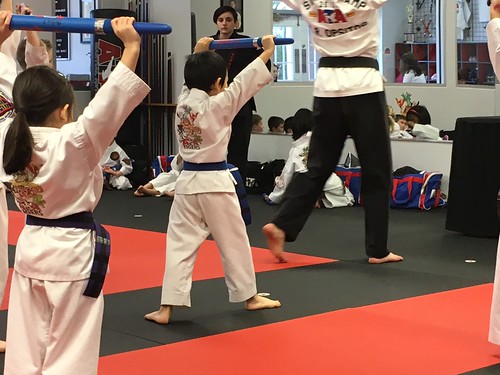
ATA color belt testing
High block


We think that T has shined in this setting, and anyplace like that where we have been able to create that. We get worried when he gets too many accolades this young, because we want him to be ready for the challenges in the future. And at this age, it is best if he is always learning and competing with people who have natural advantages over him, so when that changes, he will do well.

Tuesday, July 28, 2015

Lessons in teaching: teaching exploratory data analysis with R

Last spring, I took over a course labeled as information systems engineering.  This is aimed at sophomores in engineering.  Historically, this course focused on using the MS Access database.  I was asked by the department to take this over after several years of commenting that our engineering seniors have inadequate computer programming skills, as evidenced by the amount of effort they spend on their senior projects doing tasks that would have been much simpler if they tried programming.  Last year some of the faculty tried experiments in their classes where they had students code in an assignment (generally they asked for C). In every case this went very badly.  So they asked me to take this course and change it so that it covered programming and specifically to use R. (I am effectively the primary data analysis faculty here).  In keeping with the course title, I chose to focus the course on data analysis, with one month focusing on databases and how to think about data problems (and giving them time to gradually learn R), the rest on exploratory data analysis.  I used as the primary text Data Manipulation with R by Phil Spector, and as supplements GGplot2 by Hadley Whickam and An Introduction to Data Cleaning by Edwin de Jonge and Mark Van Der Roo. I presented the CONVO framework for thinking about data problems based on Thinking about Data by Max Shrum.

As freshmen, they would have has CS0 (the Association for Computing Machinery designation of introduction to computer science for non-computer science/electrical engineering majors) material covered over a two course sequence that also covers mathematics for engineering (primarily linear algebra).  The language of instruction is primarily Matlab, but they also cover C and, depending on instructor, Python (there is one module that is sometimes covered by Physics faculty, and they like to use Python).  For databases, there is another course on databases taught by an adjunct faculty who used to teach databases for information systems.

For tools I used SQLite (more on why this and not MS Access later), SQLite Manager, R, and R Studio. Prior to the end of the previous semester I sent everyone an email with links to videos introducing them to R and R Studio and encouraged them to introduce them to R through typing out a tutorial (I explained that they would actually learn R over the semester, the typing exercise was to ensure they had seen everything once before we actually needed it in class.).

For assessments, there were weekly labs for computer knowledge, exams mostly covered how to think through data problems. A semester project with two milestones (plus completed project) was the main way to assess how well they developed computer programming competency.  Each week, we covered one

We had three datasets that I used as teaching and lab examples throughout the course.

  1. Titanic survivors
  2. National Survey of Family Growth
  3. American Community Survey (U.S. Census, Pittsburgh North PUMA)


Some observations and notes

1.  SQLite vs MS Access.  I was surprised to find out that MS Access has a relatively low size limit on databases. It was not able to handle either the National Survey of Family Growth (expected) nor could it handle a single PUMA for the American Community Survey (this was a surprise).  That meant we had to use SQLite for the entire course. (my Mac students were happy since this put them on equal footing with the PC students). Next time I will just use SQLite. (and use MS Access only to explain why we are not using MS Access)

2.  Learning R.  In a pre-class survey, the entire class indicated complete lack of confidence in programming to fulfil a task (expected).  I think that the standard programming language belief that it is always easier to learn a second programming language failed in this case, because I did not realize just how bad their first experience was.  While the first month was very intentionally a confidence building exercise, I think that for a portion of the class, they really needed to start from scratch.  Next time around, I will spend an entire period doing nothing but walking the class through R.

3.  Data manipulation.  This included covering data structures (text, dates, dataframes), regular expressions, plyr, reshape, and missing values imputation.  Essentially the Hadleyverse v. 1.  One issue here was the wide variety of potential topics. While I think every topic got used by someone in their semester project, some of the student evaluations complained about my teaching topics that were not on the exam.  Essentially, for people who are only used to computing on numbers, the entire topic of data manipulation seems to be a heavy cognitive load.

4.  Visualization.  I taught qplot, but I think that I should have gone straight to ggplot.  I think that either I go the traditional route and build every type of plot as an individual entity, or I present the grammar of graphics approach and build plots. Either way, now that I've taught it, I don't think qplot helps in either, and it is a lot less capable. (every groups final project pretty much had to transition to ggplot)

5.  Projects. I let  the students find their own datasets and questions, subject to the fact that they had to write the project purpose using the guidelines we covered in thinking about data.  The big division in quality of the projects was the richness of the dataset.  Next time, I will be a lot more strict on the dataset, in particular, I had a subjective guideline that they should not consider it practical to look at the whole dataset. In some cases, this still was a very small volume, and it made for a trivial and uninteresting report.

6.  Thinking about data. I used Max Strum Thinking about data framework where for a data project, one should identify the COntext, Need, Vision, Outcome.  Every week we read a contemporary news article that included a data component (mostly from the fivethirtyeight.com website)  Each discussion opened up with class discussion to summarize the article into this CONVO framework, then a discussion of the analysis in the article itself.  This actually worked out pretty well.  Each exam had at least one CONVO focused question, and generally they did well (and of the people who did not, there were no surprises based on class participation)

7.  News articles.  I had a wide range of news articles that we covered in a weekly discussion, drawn mostly from fivethirtyeight.com, the Upshot column from the New York Times, and the data series from the Washington Post.  Each article was assigned at the end of the week, for discussion in the Tuesday morning lecture.  Discussion opened up with a summary based on the CONVO framework, then we evaluated the data analysis presented in the article, followed by how we could change it to make it better or to answer a different question.  These class periods were fun. My goal was to take 15 minutes for each article, in a few cases we were on a roll so we let it go to 30 minutes.  I had good participation.  And it showed in the CONVO question on exams, and generally people did well when I asked them to imagine a data analysis based on data presented on a test (this was the last part of a multi part question, where the other parts were about the data presented). One disappointing thing was that when it came time for course evaluations, I was rated poorly with how the class material relates to the everyday world (like all engineering courses do). So I have to figure this one out.

8.  Course evaluations. When course evaluations came in, they were roughly a uniform distribution, which makes them very hard to interpret. In addition, comments that expressed weaknesses were mirrored in the comments that expressed strengths. So that meant that I had terrible averages and a chat with my department chair.  Fortunately for me, the generally accepted belief is that the broad diversity in the teaching evaluation is due to pushing the students harder (i.e. making them do programming again) and that this is part of improving the department as a whole. Hopefully when he meets the dean to review the faculty the dean agrees with this assessment as well.

9.  Class projects.  About a quarter of the projects (teams of1, 2, or 3) were genuinely impressive. Many projects with 100,000s of records, a few with millions of records, several dimensions, and data analysis that used layered visualizations to explore.  Most projects were a little more modest, thousands of data points and reasonable visualizations. Some projects were personal in nature (looking at issues in their home towns), others were fun (several projects revolved around music or sports) A number showed evidence of lack of confidence, shown in very unambitious data sets.  The issue with this group is how hard to push. One of the known problems with CS0 or CS1 is that they complete destroy people's confidence in programming, and a substantial portion of those who take one of their courses completely leave the field, or in the case of engineers, avoid programming at all costs in the future.

Next time around:

1.  Using a framework like CONVO (Max Strum) works. I am pretty sure everyone at least learned how to think about problems and settings.
2.  Skip MS Access.  I think I probably spent too much time on databases and working with the MS Access interface.  Next time, going straight to SQL is probably enough, given that the limits on MS Access means that we cannot do interesting datasets.
3.  I liked using three datasets the entire course.  Actually, some of them used the American Community Survey for their semester projects (after reading in multiple PUMA, e.g. an entire metropolitan area instead of only one PUMA).
4.  One question that I will have to think about is how much of a do-over of CS0 this course will be.  Clearly, as it is most of the class seems to get it the second time around and a good portion are pretty impressive. But there is a pretty large fraction that finished CS0 absolutely convinced that programming is forever beyond them.

Friday, January 30, 2015

Lessons in teaching: Fall 2014 edition - Using the news

I had started using news articles to illustrate class concepts last year, but this year I started doing so from the very beginning and made it a standing part of the class to do this once a week in both of my classes last semester.  Of course, taking 10~30 minutes a week out of class came at a price.  In both cases it meant a chapter not being covered. And I pointed this out to the class when time came for course evaluations.

Every week I would identify news articles, magazine articles, or blog posts to discuss in class.  (or sometimes it was a historical case).  The discussion would always open by evaluating the article through a standard technique.  In my decision analysis class it was either generating a value tree or a decision tree.  In my simulation class it was generally generating an event diagram (i.e. a white board exercise).

The cases included the international and domestic (U.S.) handling of the Ebola outbreak, health care provider reactions to the rise of independent urgent care clinics, potential expansion of a light manufacturer, pulling a goalie in hockey in the final minutes, flu vaccinations, Corporate restructuring, the construction of super containerships, NASA Commercial Space initiatives, waving a (baseball) runner home, handling of death threats (Gamergate), Space Shuttle Challenger launch decision, automation of warehouses and manufacturing, delivery of disaster response services, and hub and spoke airline operations.

For the discussions themselves, it was a great way of getting students interested. Because of the wide range of topics, international, domestic US, health, industrial, sports, space, different people tended to get into different discussion topics, so across all of the cases, a very large portion of the classes contributed to the conversation at some point.

The other big benefit of the cases was to reinforce the modeling aspect of both classes. For decision models this meant many opportunities to consider the value tree and decision trees, even as we moved to other techniques and topics. For simulation, this was the chance to work on modeling while the course focused on analytical and statistical methods.  Even for those who did not take part in the class discussion, there were a few discussions that I think were particularly memorable.

One unexpected benefit was that I had an opportunity to engage in give and take.  Once we got past the first few sessions, we were comfortable with me questioning some of the responses, or asking to go a little deeper than the first answer.  (without scaring the student into a shell) Students also started asking questions, so we occasionally got a real discussion going.

Sometimes it was fairly light and even entertaining discussion (sports were good for that). And there were times that it went very serious (we looked at the decision not to provide protection from threats of mass murder with plans in Utah with Anita Sarkeesian (meaning it also involved the politics of gender oppression). Ebola was also a big one in September.

So, when compared to the loss of a chapter of coverage, I think that this was a worthwhile direction. The course evaluations commented on how much the students liked using current events as examples of material, and that they felt confident in modeling (which is only one or two chapters in each subject).  Compared to a chapter of material that would probably be forgotten, I'll take the tradeoff.

Tuesday, November 25, 2014

Using blogs and news articles as class mini-cases - How discrete-event simulation can help project prison populations

How discrete-event simulation can help project prison populations (SAS Subconscious Musings)

My experiment this semester is more intensive use of news articles as subjects for in-class discussion of examples of applications of what we are learning.  While I have done this in the past, this semester I made it a deliberate plan to discuss one article a week in each class.  So far this semester in my simulation and decision models classes, I have covered reactions to the W. Africa Ebola outbreak, Game 7 of the 2014 World Series, Gamergate, flu vaccinations, commercial manned space transport, pulling a goalie in hockey, cargo shipping, business expansion, business divestiture, automation of manufacturing, health care system operations, among other things.

I identify articles through the use of RSS feed aggregators. My news feed includes a number of feeds from a range of business school professors focusing on supply chain and operations management issues.  I follow the CDC MMWR as well as the journal Health Affairs to get health care related articles.  And the New York Times front page and Google News are good for a lot of different stories.  The key is finding an article where the reporter was good enough to discuss the various options that were available and enough details that you can figure out the values of various actors involved.

The key a good class case article is that there are potentially reasonable alternatives to discuss.  In the decision models course, the discussion revolves around identifying the courses of action available, the sequence in which decisions need to be made and information becomes available, assessing the attributes (values) of the people involved, then assessing how they may assess probabilities of various events.

For the simulation course, the focus on case discussions is on understanding how a decision maker in the article may use the simulation, then we do a whiteboard exercise where we draw out an event graph diagram to model that system, focusing on what needs to be included (states, events) based on the decision maker needs. The goal is to discuss modeling in a specific context, so we can talk about what needs to be included, and what does NOT need to be included in the model to fit the particular purpose.  The contrast is to the textbook homework problems, which generally provide a very specific context and set of details which have be included in the model to answer the homework problems.  Textbook problems generally do not include thinking about modeling in such a way to determine what is the right question and how to simplify the model to address the question.

Last week we looked at the decisions made by the North Carolina Sentencing commission.  Unlike most cases, in this case we happen to know for a fact that a simulation was used in the decision making process.

Our discussion began with purpose: why would the North Carolina Sentencing Commission be interested in a simulation of prison population. We came up with the need to plan prison space, make arrangements with neighboring states to house NC prisoners, and to allocate resources to monitor parolees.

Next, a discussion of what would the simulation need to track to fulfill the purpose of the NCSC. This would include the number of prisoners and the number of parolees. And the time remaining for each prisoners sentences. Then, we have the state of the system being the prisoners and parolees, and the terms of sentencing. (we decided not to discuss the size of the prison, since that is something that was being determined).

The last part of the discussion was where the typical homework or exam problem started, diagramming the events tracked by the system, how each events changes the system state, and then how to generate delays in the simulation.

The purpose of the exercise was to discuss modeling. Not in terms of how you build a model from a system description, but to think through how to model and make modeling trade-offs given the decision that needs to be made about a specific system.  The cost of this discussion is time, doing this results in us not completing a semester syllabus of a class that is quite analytical. But, as textbooks usually begin modeling examples with a system description and a purpose, I think it adds to the course and I think the compromise is worth it.

Thanks to Natalia, Jeff, and Leo from SAS for our conversations about this particular SAS case at the INFORMS conference. It enriched the class discussion to know what was happening behind the scenes of the Subconscious musings blog article.

Friday, May 16, 2014

Notes from teaching data science for the first time

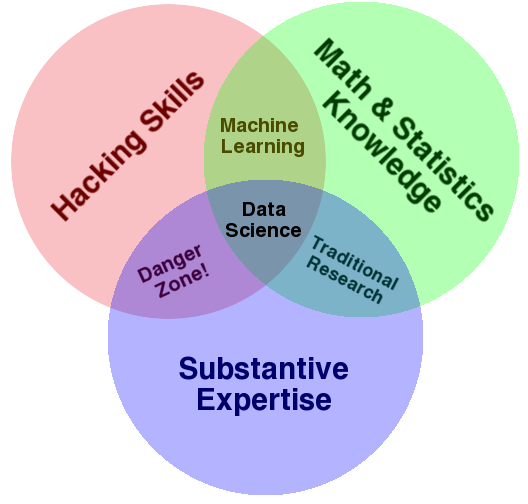
Drew Conway Data Science Venn Diagam
I spent this past semester teaching a course in data science. While there has been a data mining course taught in the department, it is offered irregularly and had a different focus.  The premise for the course I taught was that data science was the intersection of data hacking, mathematical and statistical methods, and domain knowledge (with props to Drew Conway). The students I had generally had little to no programming experience (or meaningless background). All have had a first course in statistics.

I used two texts. First was Stanton Introduction to Data Science, which is used in the Syracuse Data Science certificate program.  Second was Introduction to Data Mining with R by Luis Turgo.  All of the students were also told to go through Introduction to R prior to the beginning of the course (or as early as possible).

The class started off going through Introduction to Data Science, which included a few introductory chapters to data analysis, and introduction to R and the R Studio IDE.  Then were chapters on some basic methods at the basic level such as text processing, review of regression.  Then additional methods such as association rules and support vector machines.  We then switched to Data Mining with R which were a series of case studies.  Each case study had some form of data munging (manipulation) required, with the first one having an involved demonstration of how to handle missing values, either determining the correct value or removing as appropriate.  Each case also had a lengthy discussion of the methodologies used, with what each is being used for and a basic understanding of how it worked and its implementation using libraries in use with R (there is a book package, but it has mostly data sets and some functions to assist in data manipulation and visualization.

The assignments were built around individual projects. Their were three presentations, exploratory data analysis, preliminary data analysis, then final. The first two they could work together, but the final one had to be solo as they needed to have individual topics (even if they used the same data sets). The intent was that these assignments would build towards a final goal (but they had flexibility to bail if they wanted to mid-semester.

Probably 1/4 of the students found projects off of Kaggle, which is useful because it has a nice complex data set and comes with a legitimate question.  Another 1/4 of the students used public health as a motivating area (University of Pittsburgh is home to Project Tycho, which is a rich dataset of infectious disease in the U.S., also, there is a joint program with the Department of Industrial Engineering and the School of Public Health).

Some problems that came up. First, I discovered that many of the students had an operating assumption that all data was normally distributed, and they constantly made claims that their data was normal. Even when the data was noticeably skewed.  This was embarrassing when they would make statistical tests, and the test graphic would include the corresponding normal approximation which was nowhere near the data. I eventually figured out that for many of them, when they took statistics they were constantly fitting normal distributions in their homework data sets, so I explained that their textbook problems were written so that their would be a normal distribution to find.

Another problem was the lack of a hypothesis.  Many students started to pick problems that could be solved through linear regression and declared that because it met a p-value criteria they were done. (and in some cases, I recognized the data set as being a teaching data set). But even though they could fit a regression, there was no theory on why the data related in a given way. Essentially, they were pushing data through an algorithm without any subject understanding.  Most (not all) of them got the ideas by the end of the second presentation.

A third difficulty was skipping the model evaluation.  Most of the methods covered have some parameter that was the analysts choice, so they should have explained how they chose the value of that parameter.  Generally, this should have been a discussion of making the tradeoff between closely approximating the observed data and overfitting.  Some students skipped this completely (essentially, this is what would happen if you fed data to an algorithm then reported the result using all default values)

One big observation I had by the first presentation was being able to identify the level of programming ability by the choice of projects.  I strongly suspect that a number of students were minimizing the programming required.  But that became reflected in the level of ambition of the projects.  Non-programmers tended to choose simplistic data sets with little variety.  I think the difference is the workload.  People who could program were able to slice the data available on a multitude of dimensions without regard to scale, since the computer would do all the repetitious work, while those who could not program generally were reluctant to have large sample populations or multiple data sets on the same population.

Things for next time.  First, impress on them the need to learn to program.  Essentially, the projects from those who could program were so much richer than those who could not (even at a low level of programming skill) that I was embarrassed for those who could not program.  Second, I should push harder on the need to have a hypothesis that was driven by domain understanding of the problem. This should be pushed harder from the very beginning to discourage people from merely pushing data through statistical methods and reporting results.

For teaching data mining, I think that the organization of the course needs more methods focus. The principle text was case driven, but that meant that methods were being introduced in a fairly arbitrary sequence.  I ended up doing a methodology focused review over the last few weeks. What I should do next times is after the introductory section (Stanton Introduction to Data Science), have the next several lectures be a tour of the classes of data mining methods (regression, classification, clustering, feature selection), then do the case studies.  One resource I found useful in this are articles from the Journal of Statistical Software, many of which are focused on R packages that implement classes of methods.

This was a very good course. I wished that the students did more participation (by the final presentation, there were some points that were given based on shear quantity of comments, which several students took advantage of). Some of the projects were much more ambitious than any other done in the MS program. And I have a lot stronger argument about the need for the graduate students to know scientific programming as a skill set.

Thursday, February 27, 2014

Parenting Month 40: Learning Chinese

This is shui
This month had a bit of excitement.  T had to go in for a minor exploratory surgery. Fortunately, it had the best possible outcome (i.e. did not find what we were afraid of). He actually did very well considering this involved not eating the day before. He was entertained by being with parents and grandparents all week, which for him makes up for any discomforts.

The bigger picture has been language and socialization. We've noticed that among his daycare classmates, those who were verbal in Chinese at 2 all have stopped speaking Chinese somewhere between 3 and 4. We're hoping that does not happen with T!

One thing we have noticed is that T english is getting to be much richer than his Chinese. It is not just home and school, it is books and videos as well.  His english books are more varied and have more constructions allowing for richer speech. And I can imagine that at this age, as they are just becoming expressive, it would be frustrating trying to speak in Chinese when your English is more capable. One thing we are trying is to find Chinese language media geared for pre-schoolers. Fun Fun Elmo recently came out with another set of episodes which we enjoy. We were amused when T was replaying some of the scenes, like one piece that involved a boy giving a tour of the house and pointing out everything. We think that a key point is that Chinese be something that he can do fun things with. And that will mean playing with toys, movies, comics, and friends.

He had his assessments at day care this week, and they told us is that he assesses ahead of his age, but he does not talk to people at school. Even looking at many of the items that are labeled as 'emergent', they are things he does at home, but he does not express them at day care.  Basically, he is an introvert like his parents, the question is if he can learn to express what he knows when it comes time for assessments like this in the future.

Wednesday, May 01, 2013

A recap on work flow, note takers and task organizers

Some experiments I have been doing with workflow over the past semester as introduced on this post back in January

1.  Using Pandoc, Markdown, and pweave for class preparation.  

I did the notes for my Logistics and Supply Chain course completely in Markdown.  This included slides for in class presentation, writing homework solutions, and everything else with the class preparation.  I wrote a Makefile that took care of everything.  Basically what it meant is that to create slides for class prep I wrote it as a text file.  It does force some simplicity because there is no ability to tweak a slide or an image.  But that is probably a good thing because it forces efficiency.

One nice advantage of using pweave for homework and exam solutions is that it makes it easy to have multiple versions of an exam.  If I have equations and steps in place, I can change a few parameters, and maybe an assumption or two and I have a new problem with not much extra work.  Also I did a lot of cut and pasting of code.  The code I wrote for presenting in class became the code that I used to solve the homework.  And since I let them see the code (and I also copied over the equations needed to solve the homework) it connected the homework solution to the lectures.  One issue is that so few of my students were competent programmers in any language that the Python code was not all that helpful to them (other than proving that I did indeed solve the problem)  But this was a definite success.

2.  Using Mercurial as a hosted version control system.  

I had to work with a new team on one project I was working on, so the first thing I did was to move the  former post-doc's work into a version control (Mercurial) and put it on a hosted repository (bitbucket).  And we spent a month refactoring the entire thing to separate out the code from the site specific bits (because we were going to apply it to a new location).  The repository meant that we were able to be aggressive in refactoring (yes, I did have to completely through out a day of work at one point because what I was thinking was not going to work.  All I did was wipe my directory and reclone the repository)  The others got into the hang of putting everything in the repository as well.  Now, the comments are not all that good on the part of the post-doc and grad student working with me, and we tended to work in separate areas so it was not true collaborative programming, but it was not bad.

I plan on continuing this over the summer with a few students who are learning agent based modeling together.  The intent is that if all of us are putting our models in the repository, we can ask questions like "why does ___ not work" and we can have their model to look at.  We'll see how that works.

3.  Google Tasks as a task organizer  

This worked out pretty well.  I ended up using Google tasks as a note taker (more on that later)  I was off an on regarding being consistent, but there were periods where I had a lot going on that this to-do list being available on all of my computers, my iphone and ipad was very useful.  Keep doing this.

4.  Tomboy as a notes organizer. 

Note taking sounds like a no-brainer.  Not.  This one pretty much died.  In February Canonical eliminated an API that enabled use of Ubuntu One as a storage place.  So I ended up storing the notes data on Dropbox (so my Windows and Linux machines were synced).  But the iPad app that integrated with Tomboy no longer worked, so if I was using the iPad, the notes were not integrated.  And this pretty much meant I was not using Tomboy notes.  Sometimes I would create a task in Google tasks and create a note if I needed something.  But generally this went unused.

I'm going to try this again.  But since I realize now that having it on my iPad and syncing to my computers is the key to the whole affair, my main focus was on the iPad integration.  So I am looking at Simplenote for the note-taking. It is originally designed for iPhone/iPad, and there are applications on Windows and Linux that integrate with it (and also the Google Chrome browser)

Sunday, January 06, 2013

Personal experiments on workflow, note takers and task organizers

This semester I'm undertaking a few experiments in productivity.  Now, most of my work as a professor does involve computers, either developing and implementing models and methodology, preparing course lectures and materials, and communicating, and managing others.  And this spring, I have a fairly challenging schedule from an organizational standpoint.  In addition to the standard course and research projects I am working with a new (to me) graduate student and post-doc, I am running the department senior project course (with the department chair to back me up), and I am involved in one of those long-term career milestones.  So part of this past winter break was spent setting up systems to improve productivity.  Some minor workflow issues.  And some larger ones.

1.  Using Pandoc, Markdown, and pweave for class preparation.  

I long ago decided on Beamer as my preferred method for preparing presentations.  Using LaTeX essentially forces the use of styles instead of fiddling with page layout (or having your styles get overridden without notice) and I can focus on content rather than form.  But there is alot of scaffolding that goes into any LaTeX document.  Enter Markdown.  I already use Markdown with R using knitr, which allows me to keep both the documentation about a method along with its coded implementation and the output of the code in a single document with a syntax that is not that far off what you would naturally do if you had to format a document using plain text (e.g. using Underlining and blank lines to set off headings or '*' to identify emphasized words.)  So Pandoc is a utility that allows me to use Markdown format to generate slides in HTML5 or as PDF files (via Beamer).  And pweave does for Python what knitr and Sweave do for R, combine the documentation of algorithms, the implementation, and the output in a single document where the output will automatically update as the implementation or the input data changes.

So now, I can build slides in Markdown that includes the lecture, the math model, a Python implementation of the math model, and the output of the implementation.  And since Markdown is a lot less complex than LaTeX, hopefully do this faster than I was before.

2.  Using Mercurial as a hosted version control system.  

I was running a project that was based on a simulation being built over a period of years by a post-doc.  However, he was really the only one working on the code.  It was at the point where I wanted to do some side experiments with our model, so I wrote another implementation in Python. (note, using SimPy, it took me two weeks).  But now he has moved on, and I'm still working on the project with another post-doc and grad student. So, since they are new, and we are jointly working on the model to apply it to a new system, I've taken the model from Dropbox (shared folders) to distributed version control, namely Mercurial on Bitbucket.

While Git is the more popular (at least among hipster elite programmers), Mercurial uses commands similar to Subversion (which the post-doc already knew) and tools were readily and obviously available for both Windows and Linux.

I've been using Mercurial and Bitbucket for my own projects including coding and writing papers in LaTeX for a while now, but this is the first project of my own that I have other people working with the same repository.  So I'm training them along the way.

3.  Google Tasks as a task organizer

I've started using Google Tasks. At one point I was using Remember the Milk, but I stopped because it was not integrating well with Google Calendar (which is how I do my scheduling). (RTM put an entry into every calendar day, which means I had to open my calendar to see if the marker was real or empty)

So with Google tasks, I can create a task in the Google Calendar sidebar, in the sidebar of Google mail, or there is an iOS app (GoTasks). The interface is not as pretty as Remember the Milk, but it works better with my Calendar. And the iOS version is not crippled (RTM is limited to one update a day on the free version).  The main criteria here was the fact that it worked on all of my computers (I use Windows, Mac OS X, and Linux in different settings) as well as my iPhone and iPad (because I often go to meetings and trips with just my iPad and not my laptop)

4.  Tomboy as a notes organizer.

This past fall I was working with an undergraduate who learned the use of MS OneNote while a summer associate with McKinsey and I was impressed about how well he could organize and use these free form notes. I had been using Google Docs to do this, but the need to get on the internet, fire up the browser, and then work was sometimes too much, and it was hard to organize.

Tomboy is a fairly lightweight application.  It provides a formattable and linkable text area, but not as heavy as most desktop applications.  Tomboy can also work with a cloud storage account such as Dropbox or Ubuntu One to keep the data in the cloud, to be synced whenever your computer is on-line.  So now, I have set up a notes folder for the senior design project, with subfolders for each team, a folder for my major research project (with the grad student and post-doc), and my other project.  And I know have collections of short notes that are each dated, identified with keywords, and linked to each other as much as needed.  And I can access and edit them from each of my computers, my iPhone and iPad.

So, here is the great experiment, cobbled together in the midst of all the other work and writing I was doing over the winter break.  And next week is when the fun starts.

Sunday, December 09, 2012

Lessons observed from using cases in teaching decision analysis

I taught a course in Decision Models last semester. While there was a text, instead of relying on the text for the assignments, I used cases to provide practice in applying the concepts.

I chose two cases from the INFORMS Transactions on Education, Home Depot and the OVA1 case. In addition, I had them read a book "Against the Gods" by Bernstein, and a personal case. The class as a mix of undergraduate and graduate students. All of the undergraduates were US born while the graduate students were more varied in background including US born, Chinese, Indian, Turkish, and one Western European. A few had work experience.

The Home Depot case was a multi-attribute decision making case. I had the students form teams of two and take a point of view in the case: HomeDepot, competitor, the local government, or local residents. While the case writers used one method, I had them structure according to SMART, which is what was used in out textbook and the class. Some notes. The students often had trouble staying in a point of view. This led to some strange arguments during the course of the case report. Also it made the assessment of values difficult for the students, as observed in their discussions and the values they assigned to attributes. Noone had background in the issue, except for one student who witnessed a similar debate in his hometown. They found assigning numbers to values difficult, But one result that I pointed out, also noted by the case writers, was they were remarkably in agreement in their final recommendations, even though their choices of. numbers varied wildly. As noted in the book and by the case writers, this was one of the justifications for the value of structured decision analysis methods in a highly subjective environment. I think that this exercise gave the course validity.

We also covered the eventual outcome. As the case writers expected, they generally came to the same conclusions as the decision in real life. But the eventual outcome s not very good, and in real life it is being revisited, so we could talk about if the decision was good even if the outcome was not as good as hoped for.

The OVA1 case was on medical decision making, and teams could be the doctor, the patient, or an insurance company. There was one person considering medical school in the course, This was used as an exercise in developing decision trees and assigning utility in the face of uncertainty. in addition, this was before they covered the value of information, so they essentially, they were developing the techniques of determining the value of information as they went along. They did much better with keeping with their assigned role this time around. And it took work, but they figured out the expected value of information method, which made teaching it later very easy. Also, the case got across the idea that decisions look very different when looking over a large number of instances (doctor and insurance company) compared to when you looked at a sample of one (patient).

The real question is the use of cases instead of homework. In an engineering department, this would naturally be one of the less quantitative courses. However, I presented it as an integrative course, meaning that the other courses teach methodology that are used to support decisions. Even with the case that was supposed to be based on a personal issue (I gave them some leeway by saying that it could be based on something or someone they personally know instead of just themselves)they commented on how hard it was to find data or determine utility in a quantifiable form. I think that presenting this in the form of cases made them work harder at it and gave them a deeper understanding than if I had them do a homework questions from the book where the numbers were given and they did not have to think about where they came from. I had many people comment in their reports that this class was making them think about many issues differently. (especially the personal case, where most of them even thought to include such considerations of their romantic relationships in their evaluation of decisions.)

Thursday, December 29, 2011

Ghost Story by Jim Butcher - What is the goal of training the young?

Ghost Story (The Dresden Files,  #13)Ghost Story by Jim Butcher

My rating: 4 of 5 stars


So, Harry is dead. But apparently not quite. He is now a ghost. And he knows nothing about how to survive as a ghost. Fortunately, he soon meets some guides to mentor him along the way.


Along with the rest of the story, Ghost Story is the story of the training of the young. While Dresden has been spending years training an apprentice. But throughout the series Dresden has had a problem with trusting others. He has made a practice of hiding the truth of dangers and the realities that he faces from those around him. Even after it repeatedly gets him and those around him in trouble. And now that he is dead, he is not able to help his friends when they inevitably get caught up in things bigger than they are So throughout the book he learns of what his friends have been doing to compensate for his absense.


The question at hand, was his way right? In his absense his apprentice has gone off on her own, and one of his old acquaintances has teken up the task of continuing her training. And his friend comments that she was training his former apprentice to survive in combat, in a world that was harsh and unforgiving. While he has been derelict in his duties in coddling his apprentice.


Was she right? I have a young son, who we are hoping to raise so that he will be able to handle the world. And I have been entrusted with the training and mentoring of graduate students to prepare them to face the world and to survive and thrive in it. My wife and I have promised that we would not coddle our son, that as he grows we will prepare him for the world that he will be a part of. That may not be forgiving. We do not promise success. But we promise that he will not into it blind. And we will have prepared him so that it is possible for him to thrive. But in the end, he will be the one who has to learn the lessons, develop the skills, and go into the world.


View all my reviews

Monday, December 26, 2011

Teaching Notes: Simulation Fall 2011 and using Simpy and Sage

This was my first semester teaching a graduate level (research focus) simulation course. The department has not had this course in quite some time. There is a master's level graduate course taught by an adjunct professor that focuses on simulation modeling (i.e. building the models, with an explicit de-emphasis on analysis). This course, in stark contrast was to focus on the analytical side of simulation with a de-emphasis on model building (i.e. the models used would be considerably simpler then would be expected in the other course, including the project).

The other goal was to learn a new simulation library. I wanted to learn to use Simpy simulation library as it is used by researchers associated with a computational research center at my school. I was using this within Sage, a mathematical programming environment. Sage in its notebook mode was how I was going to present the material, as it allows for mixing formated text as well as showing the results of calculations, graphing of results, etc. I wanted to test live generating of graphs and output of random simulations, to demonstrate the effects of randomness throughout. I let each student choose a simulation platform. The standard here was Arena. The other options were simulation libraries targeted at various simulation languages such as Simpy (Python), SSJ (Java), Simlib (with the Law and Kelton books for C/Fortran) or Omnet++ (C++).

The students were a mix of engineering PhD/MS students and students in the MBA/MS-Industrial Engineering (IE) program. Note that there is some selection here, as everyone is fully aware that the other graduate simulation course would be offered in the spring. Actually, one of the MSIE students had previously taken that course. Most students used Arena. One used Simpy and one used Matlab (i.e. roll his own)

Some notes
  1. Teaching MBA/MSIE students was fun. If this is what teaching MBA students is like, I'm all for it. These students were attentive, frequently asked very insightful questions, eager to learn the material and implement it, and were quite appreciative of the analytical focus of this course. A few of them mentioned that since they were interviewing for jobs, topics covered came up in their interviews (clearly, these were quantitatively oriented MBAs). One issue was during projects, as one of the PhD student projects was based on what he was exploring as a PhD thesis, I had to explicitly state that there were different standards for projects.
  2. An analytically focused simulation course was the right idea. The MBA/MSIE students liked it and appreciated the difference, including the one who took the other simulation course previously. Focusing on the use of simulation instead of the building of simulation models put the emphasis on the use of simulations for decision making (which allowed the MBA students to bring in what they knew from other courses with them). And for the PhD students, implementing analytical methods gave them an understanding of the field. And a decent part of one PhD dissertation is going to come out of the course.
  3. Simpy - I liked using Simpy. I found it fairly easy to pick up once I started putting some time into it. One issue was the general flexibility of programming language simulation libraries compared to commercial packages. My general pattern for solving a homework problem was to (i) take code from a similar problem, (ii) (re)write a class to incorporate the differences, (iii) write data collection code (iv) analyze results. But what happened to those who used Arena was they could not get modules to do what they wanted, and developing data recording procedures for an arbitrary performance measure and getting the per-replication output in Arena could be a daunting task. So what took me 20-30 minutes sometimes took the students hours.
  4. Sage - The Sage notebook view was very useful since it allowed the mix of formatted text (like a Powerpoint slide would have), along with live calculations. I used this along with simulations to demonstrate the effects of random variables and to show how various formulas and algorithms are actually implemented. (the descriptions in books and articles skip implementation details) Having the description alongside implementation made sense. When asked, the students preferred this version over the alternative of me drawing on the board (which I also did on occasion) and definitely better then Slides (with the benefit that slides give of having distributable lecture notes). One other benefit was I had to make sure I understood everything, because I would implement every procedure discussed in code including charting before giving the lecture, since the implementation was part of the lecture. There was a similar downside of the students not being able to efficiently replicate the analysis, as they were mostly using Excel spreadsheets for analysis and it was sometimes time-consuming to do tasks that programming made quick.
  5. Sage data analysis. Sage uses the Matplotlib library for data display and graphics. It is reasonable capable, and I have more flexibility than say R. But the tighter integration with the data analysis techniques already built into R make R a better platform when it comes down to it. Sage/Matplotlib has the advantage that modeling can be done in Sage/Python, allowing for all in one tool. (R can be accessible from within Sage, but it is not straightforward once you get past the R core functions)

Conclusions

  1. An analytically focused course works, even with non-PhD students (who were admittedly self-selected)
  2. The Sage notebook view is useful for teaching purposes. Formatted text, LaTeX for equations. Sage's ability for typesetting symbolic math and putting descriptions as well as implementation side by side was useful. Especially in stochastic settings where people do not have well developed intuition on the effects of stochasticity. I like this as a teaching environment. Unfortunately, this seems to be difficulty to teach people how to install it so I'm on my own here :-(
  3. One issue is having people in the same class using commercial simulation packages and programming languages. It is very easy to create a problem that is unexpectedly difficult in a commercial simulation package (and I have no reason to believe that it is a particular failing of Arena). The lack of flexibility in modeling, data collection and analysis makes it easy to get a student in trouble. And I am convinced that this occurs in practice once you leave the core domain the packages were designed for. (I get direct personal contact with representatives from the companies behind a couple of the packages so I get to have this discussion directly with them.)

Sunday, August 07, 2011

Lessons learned: working with high school students

In the New York Times Education section there was an article on how high school students are looking for experiences over their summers beyond the usual summer job (For a Standout College Essay, Applicants Fill Their Summers). This summer I had three high school students working for me on various projects. They had come through my department chair, who was aware that I had more project ideas then money and suggested them to me.

Over the course of the summer I had them working on a mix of grunt tasks and substantive ones. I think a lot of times high school interns end up doing data entry or manual labor tasks. And I had them doing such things.


  1. Entering data from forms written by teams that were in the field (i.e. on foot when they collected the data)

  2. Entering data into a spreadsheet model from multiple sources (census, address lists, etc.)

  3. Developing process maps from a process description

  4. Running a simulation and performing sensitivity analysis

  5. Debugging and running linear programming models and analysis


Some thoughts


  1. Clearly the high school students (juniors and seniors) I am seeing are taken from the top. I was impressed by their desire to carry out the tasks. I had to gently remind one of them that I wanted to know about difficulties as well as progress, because I actually did want the tasks done. (or there were alternatives if something was impossible. The difference between a school assignment and a research project is that research projects do not come with guarantees that they will succeed.) I have a hard time with graduate students who give up too easily.

  2. I could have pushed harder. While high school students typically do grunt work, I had them running models. Talking to them at the end of the summer, each of them said they may have been able to do more technical work. One of them had started learning R in the middle of the summer (for someone else). I think that if I started teaching them programming Python or R at the beginning of the summer, we would have found reason to use it at some point, and do it better then trying to learn programming when a specific task came up.

  3. They were very eager and inquisitive. Lots of good questions. Which came in useful since I wanted to have better documentation of the models and they would ask about what they did not know (because it was not in the current documentation)


This was a good experience. I don't have much experience working with kids (to me, everyone before college), so this was a good one. From talking with each of them over lunch, it was for them too.

Sunday, December 19, 2010

Lessons Observed: Learning Bayesian Methods

I've been working with one of my students in a project that involves identifying a proper probability distribution and parameters for a fairly complex and diverse data set. As we did our literature review, one thing that was very unsatisfying was the fact that many published papers either used data that was unavailable at the time needed, or employed magic numbers as part of their method (magic numbers are arbitrarily chosen constants). As she did her literature review, we discovered the applications of Bayesian methods. But neither of us had any experience in using this. At the same time, my PhD student had a problem that we uncovered during his proposal presentation. He needed another course. Solution. We'll have an independent study on Bayesian methods with three of us.

We used as a basic text Carlin and Louis, Bayesian Methods for Data Analysis and Alberts, Bayesian Computation with R as a supplementary text. The alternative to Carlin and Louis would be Gelman et. al., Bayesian Data Analysis. We chose the Carlin and Louis text because it seemed to be more technical while Gelman et. al. was aimed at social scientists (as opposed to the mathematical disciplines we came from). (Note: all of these do require some level of programming using R)

While doing this we were also looking at various Markov Chain Monte Carlo (MCMC) toolkits. The best programmer was working with MCMCPack. The least experienced used WinBUGS and I used JAGS.

Lessons learned:

1. For independent study, I should be more forceful on making them do the exercises. By the time we were done, I had implemented many of the models, but I don't think my students did.

2. Carlin was good to work with. I had gotten the instructors solutions guide direct from him (although I did not use it). I also identified a problem in one of the data files for one of the case studies.

3. Of the three of us, JAGS was the only one we got to work well. We had a hard time formulating models in MCMCPack. WinBUGS would work, but it was only good for interactive use (if you called it from R, it would open its own window to do its work, which is a lot of overhead) and we needed something that could be used as a callable library because we needed to apply this to 1000's of cases.

4. There was a benefit to involving my students in learning this field. Because I knew nothing about it, I could model the process of learning a new field of knowledge to my students.

Outcomes

1. The project is turning out to be successful. We're doing comparative performance evaluation now and it does considerably better then the other methods in the literature. The fact that Bayesian methods blend expert knowledge and historical data in a systematic way gives it considerable face validity.

2. The student that I was working with is going back to her home university with an expectation that she will introduce Bayesian methods to faculty and other grad students in her statistics department (at a university outside the U.S.)

All in all, I think this experience was successful. Not that I am an expert in Bayesian methods, but this has led to very good results that I expect to see implemented on live data in the near future. And some insights on situations that allow Bayesian methods to be more useful then most applications of it.

Tuesday, May 04, 2010

Lessons Observed: Teaching Design of Experiments

This past semester I taught Design of Experiments. The primary reason I was teaching this was that this is the point of departure from one of my research areas. In particular my PhD student's thesis builds on this field, and he had never taken design of experiments. The course had not been taught in this department for years, so I offered to teach it. I ended up getting my students, and a MBA who was working at a local manufacturing company.

1. Textbook - I used Dean and Voss Design and Analysis of Experiments. This is a very comprehensive text. For this purpose, it was overkill. It covers methods in depth. So much so that it went into areas that showed the weakness in the use of software packages. So the SAS code they have to give for examples is quite sophisticated. Minitab, as far as we could tell, was completely outclassed by the end of the course. I was doing everything in R. But I believe what my students decided that I was a better programmer then they were. For statistics majors, this is probably the right book. And I picked it because it gave perfect lead ins into some topics I wanted to learn. But it was too ambitious (and I was not even trying to cover the whole book. I was using a slightly modified version of their sample curricula) But the next time I teach this I would use Box and Hunter. Which has the advantage of having an associated R package for examples. One real good aspect of Dean and Voss are the datasets. They made a point of having real data sets in the examples and in the homework sets. So we were forced to deal with messy data.

2. Material - I was actually learning some of the material myself along the way, since I had not taken a true DoE course (only one focused on applications in simulation). So some of the lectures took me a long time to prepare. On the other hand, I found that I was developing a deeper understanding of statistical methods. In particular, I now think if multiple comparisons is an issue whenever using statistical inferences. When Tom Siegfried wrote his Science News editorial Odds Are, It's Wrong: Science fails to face the shortcomings of statistics, I was able to identify just what the misuse of statistics was for all of his points (except for the Bayesian, because I have not had much exposure to Bayesian methods.) So I learned alot about the underlying assumptions of a many statistical methods. And one of my students is actually a statistics Ph.D. student, so someone was around to keep me honest.

3. Software. The book uses SAS. I used R. My own graduate students started in Minitab and switched to R as the material in the book reached the limits of what Minitab could be made to do. The MBA stuck with Minitab and we had to live with its limits. I ended up getting much better at R and Sweave (because I forced myself to use it for everything, even when no package was found for a method). Even redoing Dean and Voss examples. I am now a big fan of list comprehensions and I think I can almost program in a functional style (as opposed to procedural and object style). I won't say I like R better then Python, but I am almost as fluent now.

4. Summary. This course took a lot of time. Partly because I was learning much of it as I went along. And I was also learning the tools as well (R and Sweave). It is gratifying to know that I actually taught something useful. The MBA student has started using the material at work (and can now go toe-to-toe with the Six Sigma Black Belts in his company when talking statistics). My PhD student incorporated some of the material into his proposal. He also keeps saying that he wish he took this class years ago (he said this after the last class I taught, which was basically created for him). And my statistics student seems to have learned a lot about working with real data. (Dean and Voss have a lot of real, and messy, data sets.) But in the future, I think I'm going to find textbooks where I can also get some solved problems, because this was a lot of work for a single class.

Friday, December 18, 2009

Lessons Learned: Notes on teaching Fall 2009

The past semester was spent teaching two classes,the introduction to operations research that is typically taught to juniors as their introduction to the more mathematical side of industrial engineering/operations research. It is a required class, so it gets the entire year at once. The other course was a new course in Homeland Security modeling which was a concept course for graduate students. We are working on a emergency response certificate program, and one of the requirements will be a quantitative modeling course.

I had the advantage of the syllabi from the last two people who have taught the course. The main issue is retention of material over time after the course. With that in mind, the course coordinator (a faculty who was given 'ownership' of the class over the long term) and I made the choice to focus on modeling as opposed to algorithms, with the goal of the students learning modeling which can be applied, even if the actual methods are forgotten.

As a preface, I think the reality is that the top students would do well pretty much regardless of how (in)competent the professor is. For them the best I can do is make the claim that something is worth spending time on. But as much as we may be proud of our top students, and we probably can't do much about the bottom, the middle is where we as professors show our worth. And I try to resist the temptation of only thinking about the top of the class in these notes.

1. Focus on modeling and sensitivity. The overt choice was made to focus the course on modeling and sensitivity as opposed to methods. Given that these are engineering students, it is accepted truth that methods are easier to teach then modeling. The issue is that these students have been taking courses that teach them how to follow procedures for 12+ years in their math and science classes, so modeling is something different. And there are lots of people who work in the field who never really learned how to do this.

One result is that the class was more fun to teach. Because the focus was on the modeling, the concepts could be introduced with examples and the models can be built up from understanding the physical example. For some of the models, after going through the example I could discuss the historical situation that led to the model. For one quiz, I used a paragraph from a New York Times article to provide the problem the students had to model.

Response seemed reasonably positive. In particular, there was gradual recognition of what they were learning as various students started clicking as the semester went on ("I've started to think in sets!"). Others were somewhat resistant, as they were much more comfortable following algorithms. (e.g. simplex, Dijkstra's, MST) There was a general resistance to visualizing the problem through the use of diagrams. In the end, the real test is if they have developed modeling skills by next year when they do senior projects. (while they have LP, queuing, simulation, etc. senior projects tend to be process improvement projects.)


2. Software. In my preclass survey of goals, more then half of the students mentioned something about using software. The textbook uses LINDO (matrix generator) and Excel Solver. I had them learn Excel solver and GLPK. I don't think GLPK was any harder the LINDO. In particular, I think software was less important then I expected. Other then the middle portion of the course that focused on sensitivity and duality, there was not much use of the software to actually solve LPs. There was considerably more time spent on interpretation of output. I don't know if the students actually got skilled at using the software. We went through a few rounds of giving instruction, in class examples, live demonstrations of translating a formulation into a model, a YouTube video (by a business school professor demonstrating the Excel Solver) and a grad student presentation on GLPK.

We also found two bugs. Excel had a tendency of giving solutions that violated a constraint. The issue is that there was a default setting for the tolerance that was positive (>0) and was less then the rounding in the standard display. So the Excel solver violated constraints, even on small problems (where finding a feasible solution should not have been too much work). GLPK had a problem with bounds analysis in the Windows version of the software. It turned out that a fix to this problem was recently found and the patch developed by a senior in the Pittsburgh IE department (i.e. someone who took this class a year ago).

3. Class management. It was a 58 person class, so very large. A large portion of the course was taught semi-socratic, mostly the overview of different types of models. While this was fun as an instructor, the issue with socratic method is you go at the speed of the fastest students. Which I soon realized meant that I was loosing a big chunk of the class, even though there is a lot of repetition involved.

4. Team teaching. For the Homeland security course, this was team taught by myself and the head of a Center that was developing the certificate. There was a problem with communication. While the topics were agreed upon, we seem to have somewhat different ideas on what the use and purpose of models are. This was made worse by a lack of a communication plan between us, so when questions came up, they were not resolved. In addition, he had his students in the class do their project that was of very different character then the rest of the class (or the stated purpose of the course), which made grading and advising problematic. Before doing something like this again, I would have to have a more formal discussion on goals and purpose, as well as plan for ongoing adjustments.

Tuesday, September 15, 2009

Teaching QOTD: This is how it will be for the rest of the semester

I'm teaching the introductory Operations Research undergraduate course. (typically taught to first semester juniors and the core usually is introduction to linear programming.) Even though it is at 8AM the first two weeks have been very lively. Out of ~60 students, there are probably 15+ that take an active part in class discussion. I have been able to teach the material almost completely using question and answer. It is not quite Socratic method, but it is very close (and lets be real, even law schools don't truly use Socratic method.)

Until today (day 1 of week 3). Most of the class was pretty dead. The usual chatter of people arriving is subdued. And I am down to a few reliables to answer questions. I felt like I was actually lecturing for the first time this semester. By 15 minutes I acknowledge the obvious and we take it nice and slow for the rest of the class.

Later today I was chatting with our undergraduate coordinator (who has a good read on the undergrads. She is a teaching professor so they are her focus.) And she told me that yes, this class is particularly good. And that now that we are in week three, the initial excitement and energy of the new semester has worn off, and this is how it will be for the rest of the semester. *sigh*

Friday, July 31, 2009

Teaching Facility Location: Lessons Observed

This summer I taught Facility Location to a mix of seniors and graduate (mostly professional masters) students. As usual, lessons observed.

OVERVIEW
The course is billed as Logistics and Supply Chain Management. In particular, it is a course number that has not been used for a while. The department has pledged to have a couple courses offered every summer, so this was one of them. Of the other courses in the department, there is one course titled supply chain management, but it focuses on production. So, in consultation with that professor, this course was focused on Outside-the-plant rather then inside-the-plant.

The original intention was to make this a combination of facility location problems and vehicle routing. The texts for the course were Facility Location: Applications and Theory (eds Drezner and Hamacher) and Logic of Logistics (Simchi-Levi, Chen and Bramel).

The plan for the course was for me to teach the first half of the course covering the basic models. After that, my sense is the goal is for the students to see as many models as possible, but it probably did not matter which ones. So I had the graduate students teach a module of their choosing while the undergraduates would present an application paper found in an academic journal (usually Interfaces).

LESSONS OBSERVED

1. Software and programming: For the course, I informed enrolled students about a month before the course that we would use programming (C was expected, but any language of the student's choosing was allowed). Early on there was an assignment that required implementation of an algorithm, this was very difficult. What this really means is we need to expose students to programming more often so they get used to the idea they have to implement what they are learning, not just learn equations. For linear programming, we used GLPK. The original plan was to try to use Pennsylvania based data and the student versions of the LP solvers could not handle that. And is it turns out, noone remembered how to use LINDO/LINGO anyway. But because they are not used to programming, this was hard too. Most of them got GLPK to work, and I suspect that it is easier to figure out then LINGO was.

2. In class exercises: The first day of class I reviewed linear programming, then made them do a formulation in class to see what you remembered. And, it was useful to know just where the students were. It was a good thing I did this. I did have to scale down the course, and I changed topics.

3. Class interests: The other thing I did was ask the students for their interests. Based on this I (i) switched out one of the major topics and (ii) for grad students that did not have a preferred topic, oriented them towards topics that people were interested in.

4. Textbooks: The Facility Location book was good, but there were no exercises and a few editing errors. Most of the grad students who presented topics covered here found it dense, and did not catch critical aspects of their topics (generally, we figured this out when they scheduled time with me to review the topic and I explained the essentials) The Logic of Logistics book is probably too technical for undergrads and professional masters, as students with these backgrounds are not used to doing proofs. I ended up using Nahmias Operations Management to cover inventory and forecasting.

5. Forecasting: If I'm covering inventory, I need to cover forecasting. This was covered as part of one of the graduate student presentations, but I probably needed to do this topic and the graduate presentation can build on it.

6. Graduate presentations: Of the 9 presentations, I'd say 2 were very good, 4 were adequate (although 2 of these were on more difficult topics, so these would probably be considered good), 1 was marginal, 2 were strikes. One of the effects was a substantial increase in variance in the homework and test questions related to the graduate presentations as opposed to mine. Part of the presentation grade was the performance of the class on the related homework problem, which did correlate with my impressions. A few of the graduate students mentioned that they have been able to apply the topic of their talk almost immediately at work, which is rather gratifying. So overall, I think the idea is sound for this topic. But I need to find time to review the topics afterwards for quality control to ensure that the topic is learned.

7. Homework: This class was compressed during the summer, so I did not get as many homework problems as probably were needed. Most topics were only covered by one assignment and one exam problem. Even at this, they seemed to take a very long time on homework. In a normal length term, I would get out twice as many questions. In addition, I think we could get their computer skills up in the first couple weeks so that their performance on the homework would improve and become more efficient.

8. Undergrad presentations: The undergraduates reviewed one application article in the literature and write a short paper and presentation. First issue is for most of them, the first article submitted for approval (I wanted to approve the articles they selected), most were not applications. As one stated "I did not understand the article, I just saw symbols I recognized" This probably means I needed to discuss the difference between application and theory better, and how to read an article. (Yes, I had pointed them to Interfaces, but somehow people found the Journal of the Operations Research Society and thought that would be a good source.) For the papers and presentations, the students were much better presenters then writers. We've apparently done a good job creating powerpoint rangers, who cannot read or write (I've called them out on their inability to read on several occasions, and letting students know on their homework that I'm pretty sure they would have done better if they read the problem more carefully. I bullet point the relevant details in the assignment.) In addition, everyone went way over the desired length (~5 pages) At the beginning of the course, all of them were concerned with how long it was and I was assuring them that there was more then enough material for them to get 5 pages of material. I should have impressed on them that the real problem was getting the paper short and concise.

Homework and exam problems: The problems I gave were a mix of computational problems and formulation problems. During a teaching workshop, one comment a more experienced teacher made that the standard for teaching and evaluation was that he determined what questions someone in the class got correct, and that was his potential score. His goal was to keep the potential score in the 90s. For me, it was 100. And I'm pretty sure that they learned the material from me, so I feel pretty good about that. But I need to find ways of shortening the feedback loop, and have more points of comprehension checking, because I suspect that could have helped some.

NEXT STEPS
I am teaching in the fall the undergraduates the prerequisite course to this. The department is going to a direction where there is a lead professor on the main undergrad courses, so we've talked some on how to teach it. The focus is going to be pushing formulations more then the actual algorithm (which none of them will ever implement it because we always use solvers). Also, we're going to try to teach a modeling language as well as Excel (and in place of LINDO/LINGO, which are essentially matrix generators) The theory being that the modeling language has a nearly direct correspondence with the math formulation, so that they will reinforce each other for later.

My other plan is to ask the students to write a paper on a journal article, which was something that I did when I took this course as an undergrad. And my thought is to have them do two papers on the same article. First the 5 page paper (with a strict limit on the five pages). Then, after they get feedback, the two page summary paper, to force them to be concise.

Wednesday, April 22, 2009

First thoughts on teaching

I submitted my first set of grades for a class I'm teaching at Pitt. Part of my foray into academics. Which means I write my standard Lessons Observed (titled following the British tradition). I'm sure that those who have much more experience then I in teaching can have much to say.

Background:
I am teaching Database Design within the Department of Industrial Engineering at the University of Pittsburgh (Pitt). It is a service class, not part of the core curriculum of IE. But it is something that is very useful for engineers to know because of the large amounts of interaction with data. I have some background, because I use databases regularly, including some rather advanced uses for one of my research projects. The class is split between upperclassmen and graduate students, with most of the graduate students being professionals going for a master's degree. For most of them, this will be their only database course. There are two other places in a university where such a course would be offered. An information science (or possibly computer science) department would likely have a concentration in this field that examines data storage and retrieval. Business schools would sometimes have information management as a field, but more likely will have a course that teaches use of MS Access.

Goal:
The course objectives where to teach database design, with the understanding that the audience are engineers, i.e. people who would design applications that use a database, not database administrators or builders of database management systems. Similarly, I decided to make it a design class, not a course in driving a software package (MS Access), although using MS Access (or other database) would be assumed. I think that defining where the course fit in with other similar courses what the right idea, because it let me do the is-is not analysis when deciding what to include. I've done that with a course proposal I've submitted for fall, as well as the course I'm teaching in summer.

Software:
I did not specify software for the course. For the database, everyone ended up using one version of MS Access or another (three different versions were in use). While it probably would have been possible to do table design and queries in any database, teaching reports and user interfaces would have been too much of a stretch unless you use this. There were some problems because I don't use MS Access myself (I generally use PostGIS and BIRT for database and reporting) so I was probably light on the examples. For the next time, it would probably be safe to state use of MS Access. For diagramming, I gave them the choice of Visio or Dia. MS Visio was installed on the university computer labs (but not the department lab) and Dia could be freely downloaded. People ran into trouble navigating Visio (it was designed for programmers, not database designers) and most switched to Dia (databases is a base use case for Dia). While this is not software course, I probably should make a standard.

Projects:
For the project, not enough people had access to a real world project, so I had them create projects, and I had teams assigned to review each other (to include adding goals to the project). This was a heavier administrative burden then I realized it would be, and I was not able to keep track of all the communications. I should have had fewer mandated interactions, and let them do informal interaction. I was not sure about the quality of the peer-review, but most of the project reports specifically mentioned that having peer-review of the project at various stages gave the projects more clarity then they would have had otherwise.

Lectures:
This was a somewhat different subject then most in an engineering curriculum, since it is very soft. And not a subject I know deeply. I was walking the line between too much information to absorb on a weekly basis, but there was not enough content on a class session basis. Probably what it meant was I should have been doing more examples, especially working the software. Another thing I should do is organizational prep work. In particular, for the next course I will be preparing a lesson plan in addition to a lecture, to give each lecture more context.

One thing that did work was spend some time on motivating the day's topic at the beginning of every class. I suspect some of them thought I was only rambling, but others were able to make it work for them in putting things together.

Value at Risk Case Study:
I have in the back of my mind a capstone lectures that declares that mathematical models are a form of communication, and I expect every class I teach will have a way to talk about this. In this case there is a module on reporting, meaning how you present summary information from the database. And I used the Value at Risk statistic that factored into some of the riskier instruments used by various financial institutions. There was a clear division in how well this was understood. By the final, all the grad students made the connection between that and the related question on the final. Only a few of the undergrads did. Probably because the grad students were intimately familiar with the problems that financial institutions were having and it held their attention better.

Research and teaching:
I am now a firm believer that research helps teaching. One of the things that made this course interesting was the fact that I had actual database projects I worked with. While the actual projects could not be done in the course, I could extract parts. And I could use actual datasets and data collection tools as examples in the course. A couple of the students complained about the vagueness of the data specifications, which would be echoed by the people who actually deal with the data in question, so that was actually good.

Use of examples:
I had three datasets that I used for examples throughout. The US Department of Agriculture Standard Nutrient dataset (used in the preparation of nutrient labels on food), Pennsylvania Emergency Management Agency damage assessment collection forms, and the MS Northwind Traders example database. In particular, I used the USDA data from the very beginning of the course. It provided a rich set of understandable data so that it was clear what happened. I will probably do that again, using Pennsylvania as a dataset in my location class this summer.